Charts
Every plan on your Jira site, on one page.
Charts is where Ganttry opens. It lists every chart on the site with its lead, dates, issue count, progress, overdue work and last plan change. Start a chart from a board, a saved filter or a JQL query, open a project nobody has planned yet, or combine two or three charts into one view.
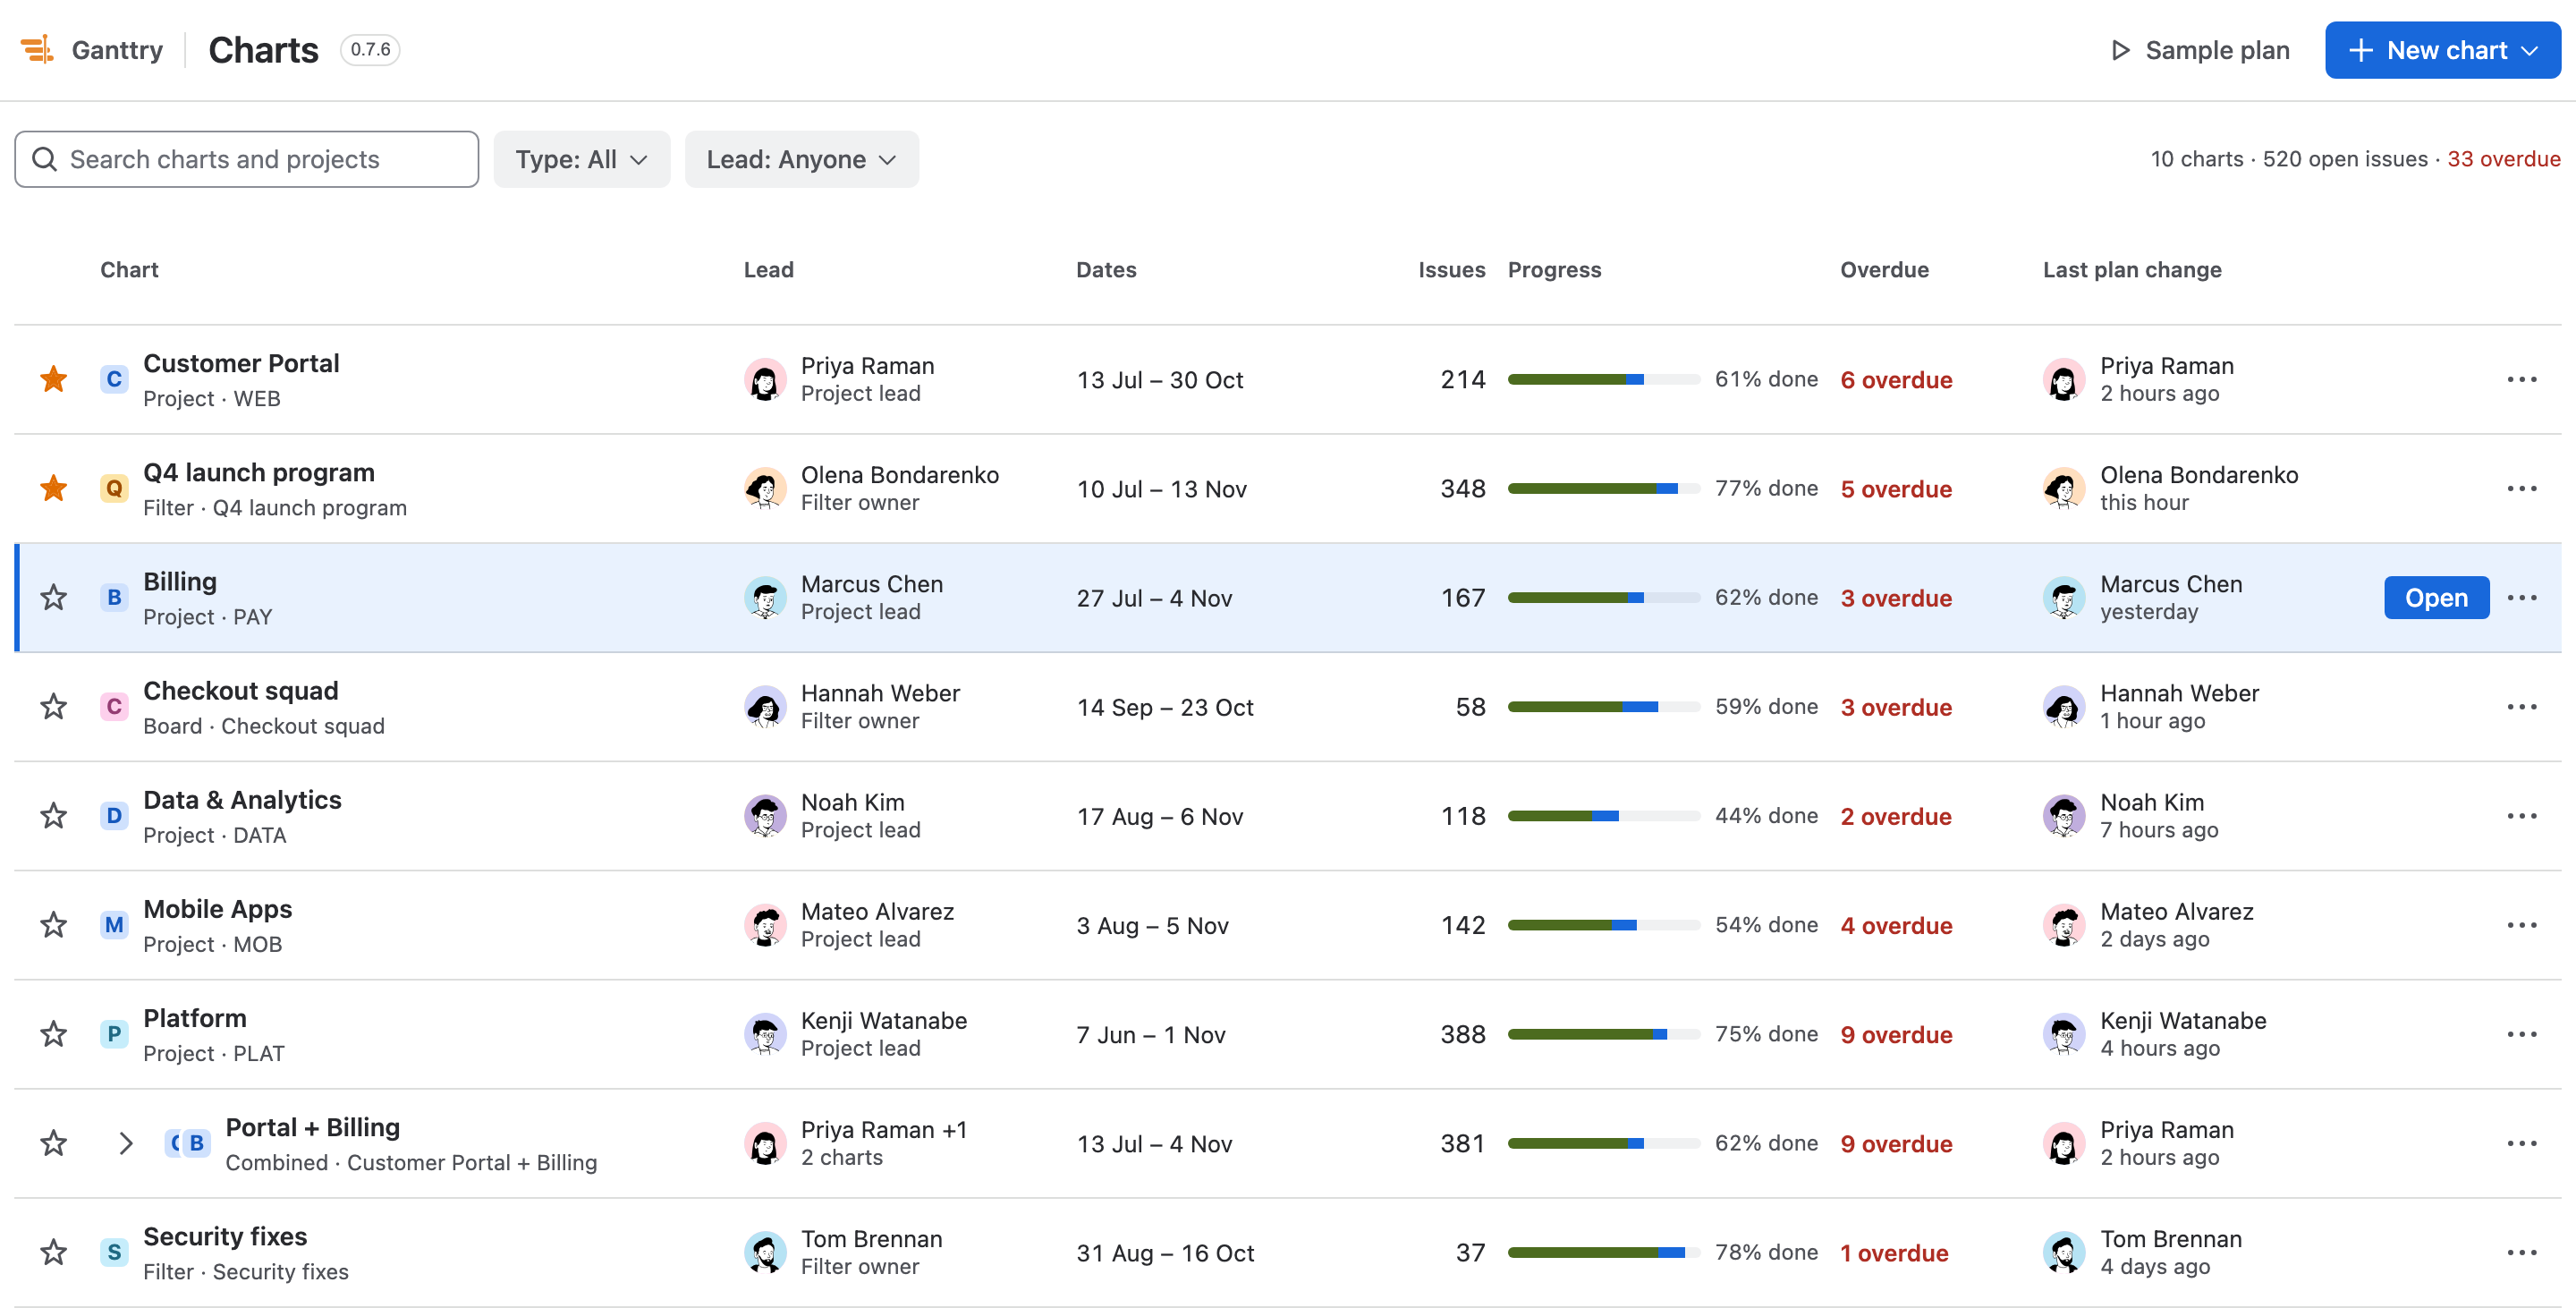
- One list for the whole site
- Board, filter or JQL charts
- Combine two or three charts
- A sample plan to try
What you get
Charts, part by part.
01
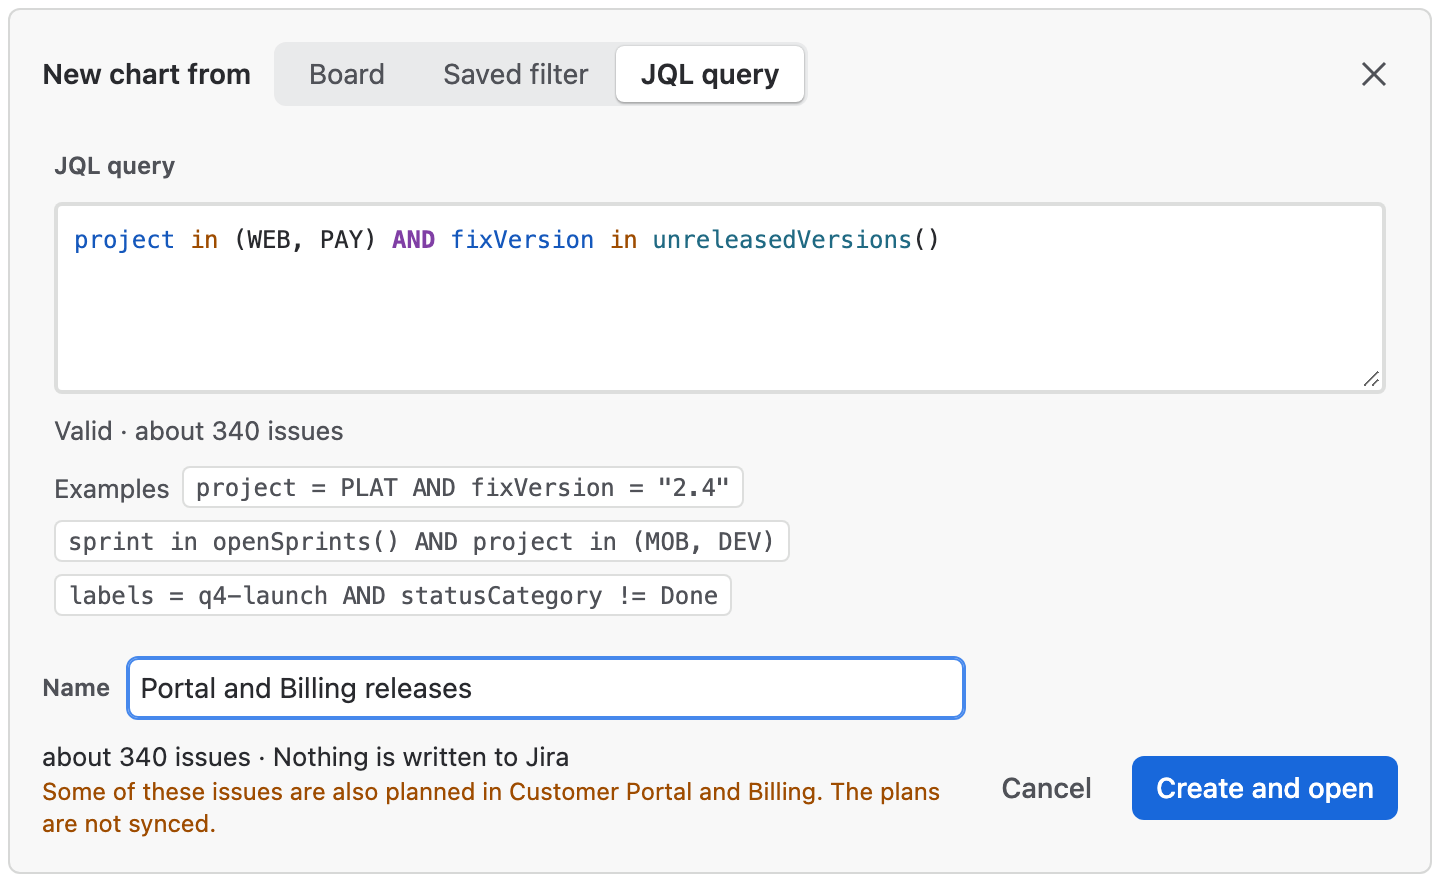
Start from a board, a filter or a query
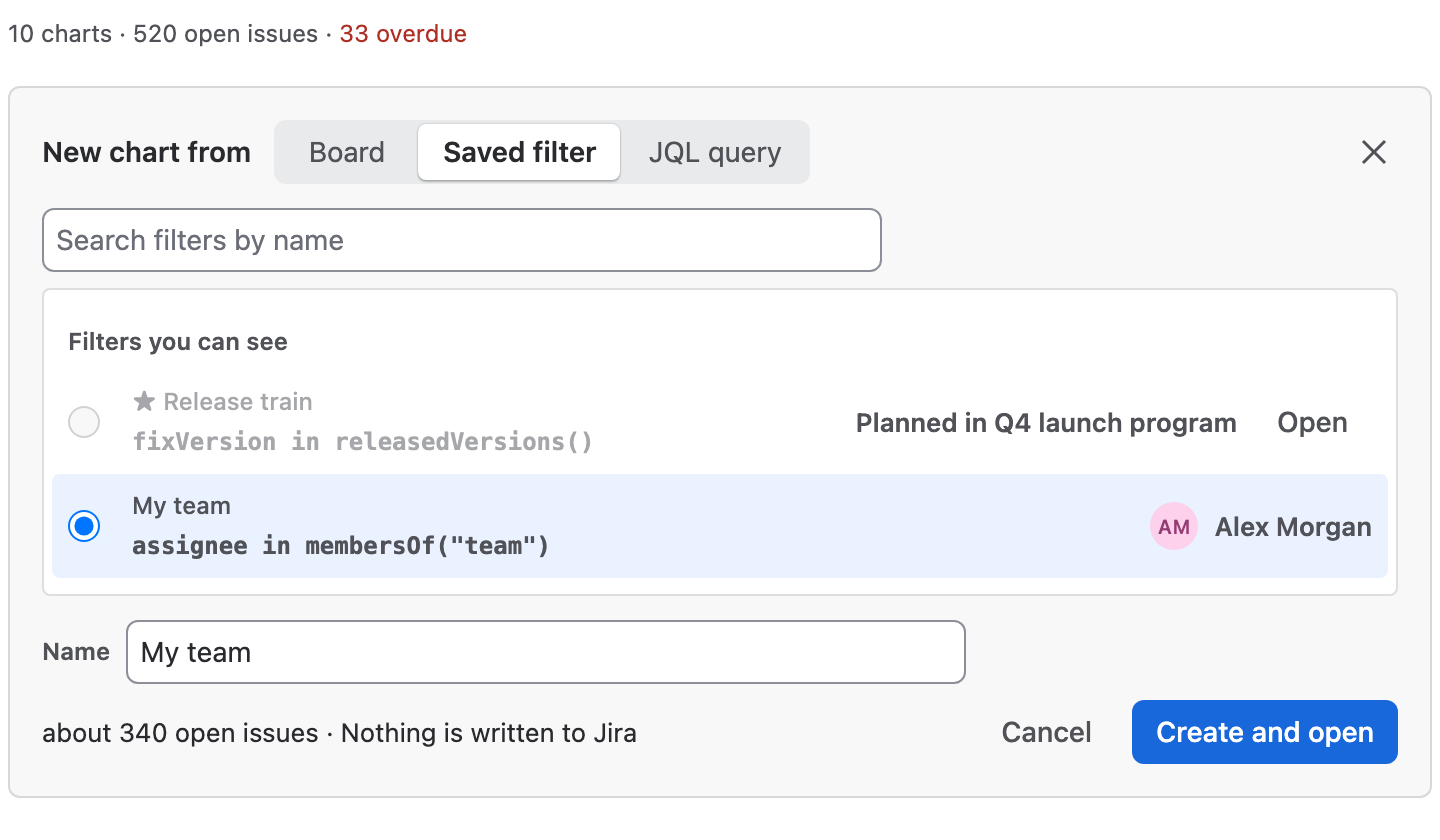
New chart opens a panel above the list. Pick a board or a saved filter, or write JQL that Jira checks as you type. The panel says roughly how many issues the source holds, and warns when a project it names already has its own chart. Create and open saves the chart and opens it.
02
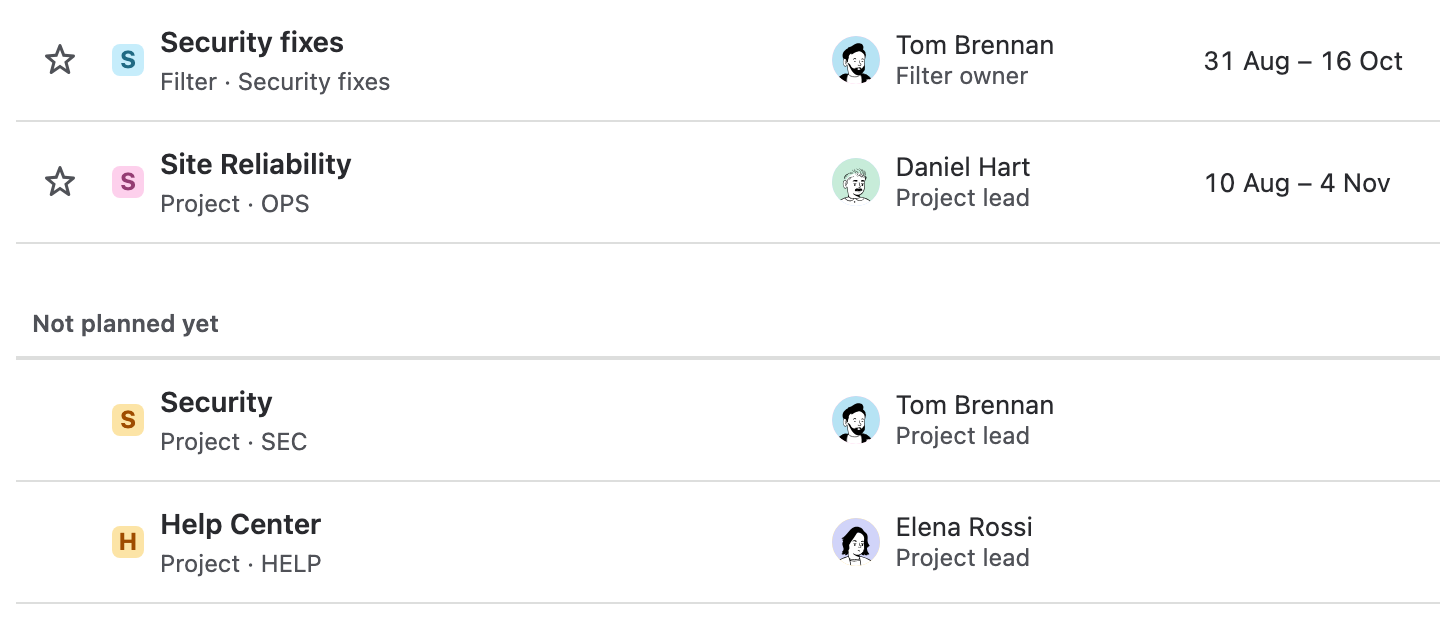
Projects nobody has planned yet
Under your charts, Not planned yet lists the projects you can see that have no chart. Open one and Ganttry saves its chart under the project's name, so there is no create step, and the project's own page in Jira opens the same plan.
03
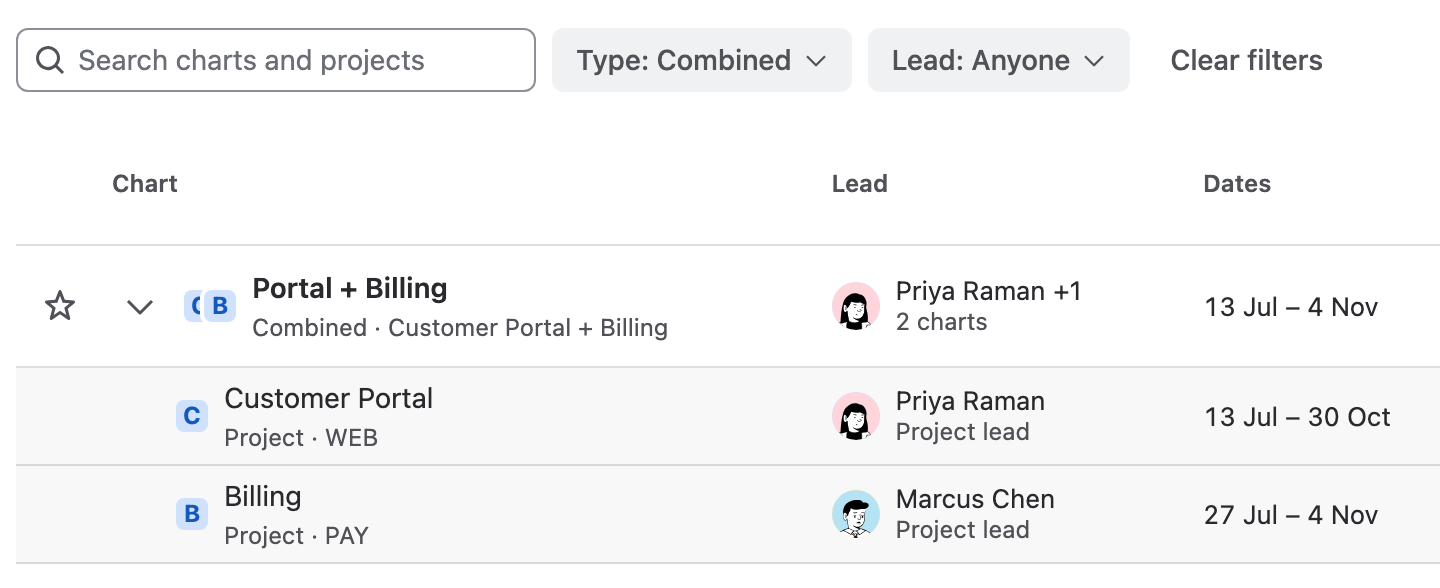
Two or three charts in one view
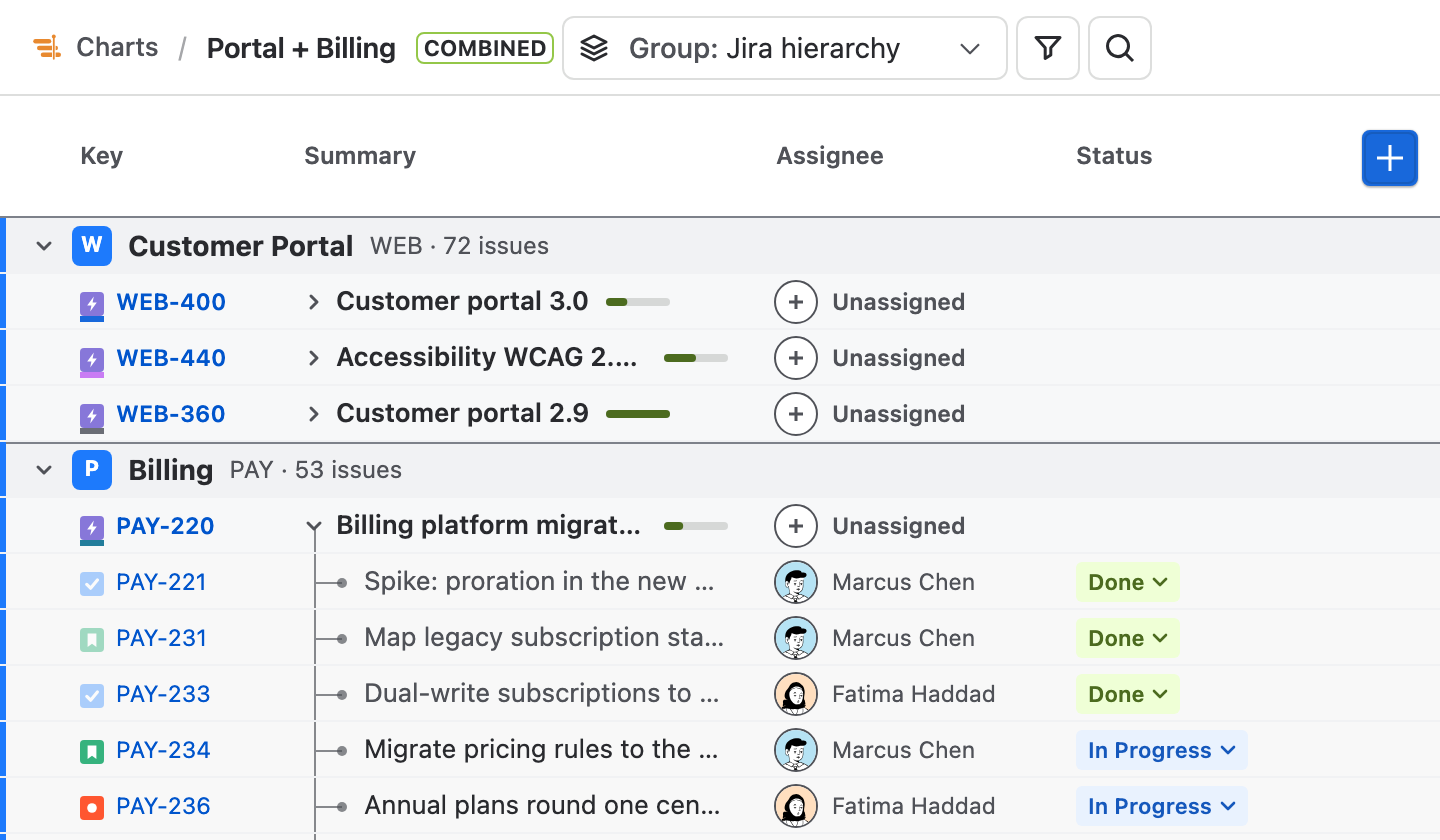
A combined chart shows its charts as sections of one Gantt. Each keeps its own plan, dates, calendar and people. Charts adds up their numbers in one row, which expands to each chart's own row.
04
Readable on a narrow screen
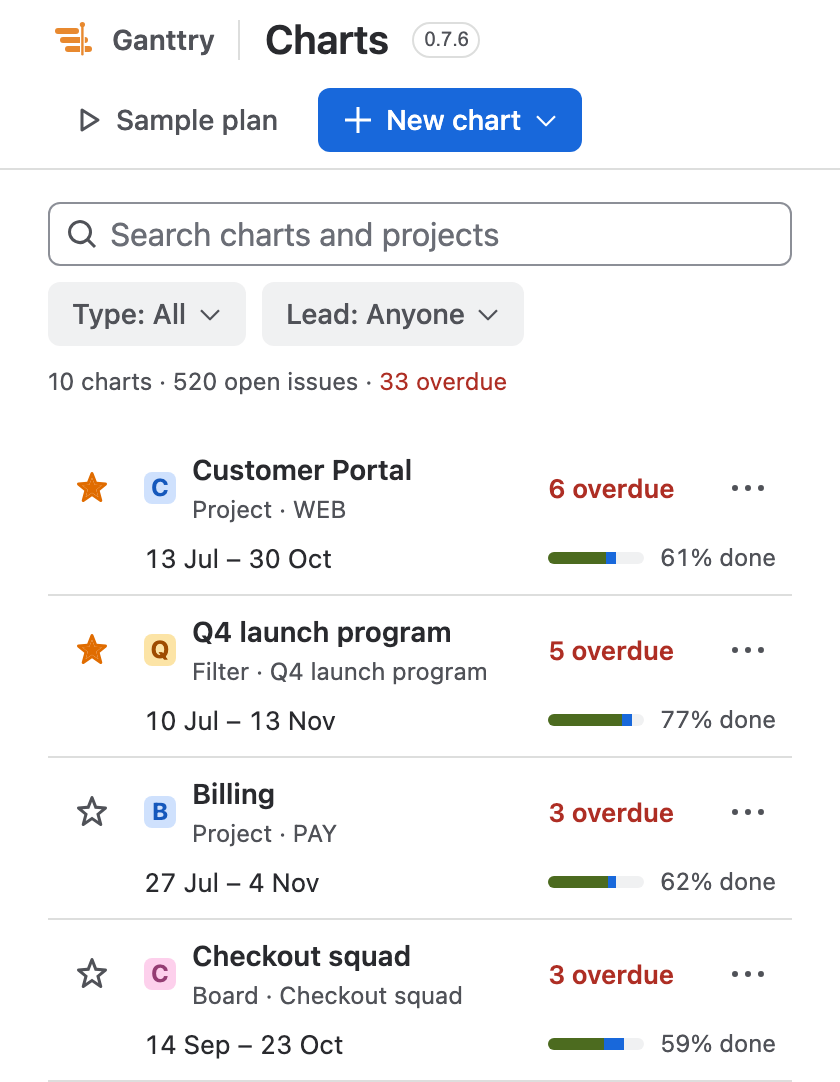
Below 720 pixels wide, each chart takes two lines: its name, source and dates, then its overdue count and progress. Nothing scrolls sideways.
How to use it
From the list to a combined chart.
Step 1
Find a chart
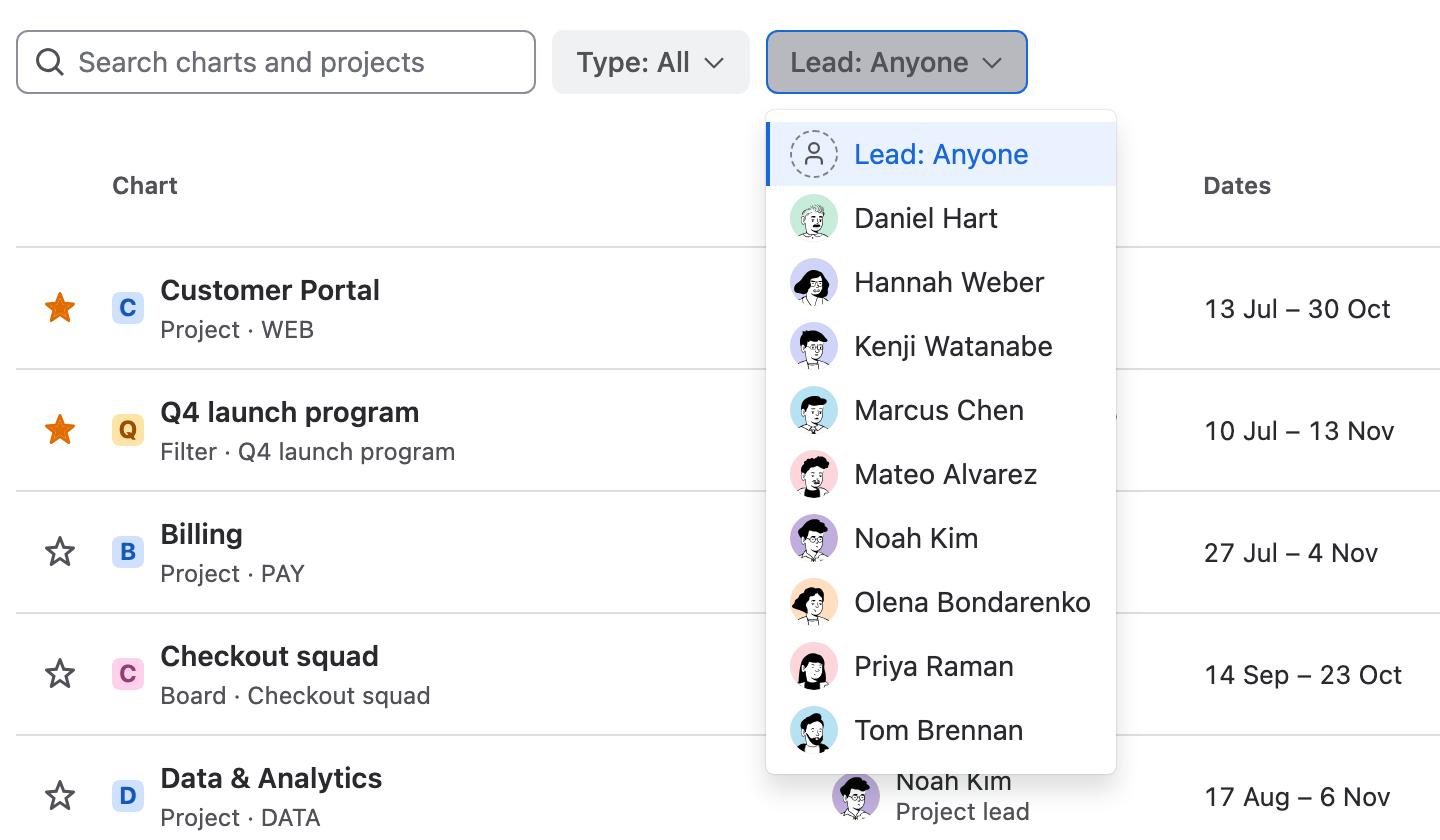
Search by name, or narrow the list with Type and Lead. Starred charts come first, then the ones you opened last. Click a row and choose Open, or double-click it.
Step 2
Start a new chart
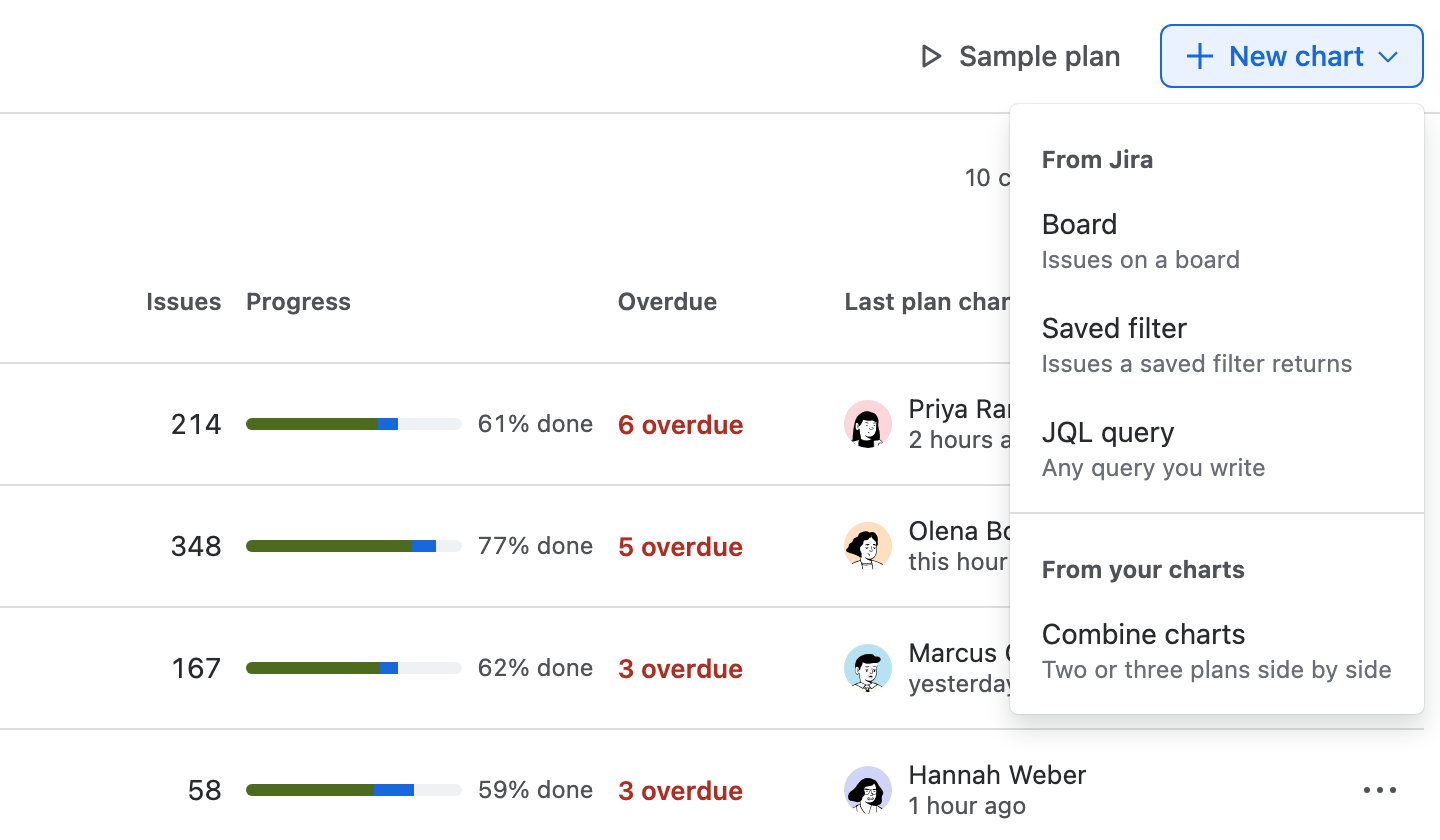
Open New chart and choose Board, Saved filter or JQL query. Combine charts is in the same menu.
Step 3
Choose the source
Pick a board or a filter, or write the query. A source that already has a chart says where it is planned and offers Open. Check the name, then choose Create and open. Nothing is written to Jira.
Step 4
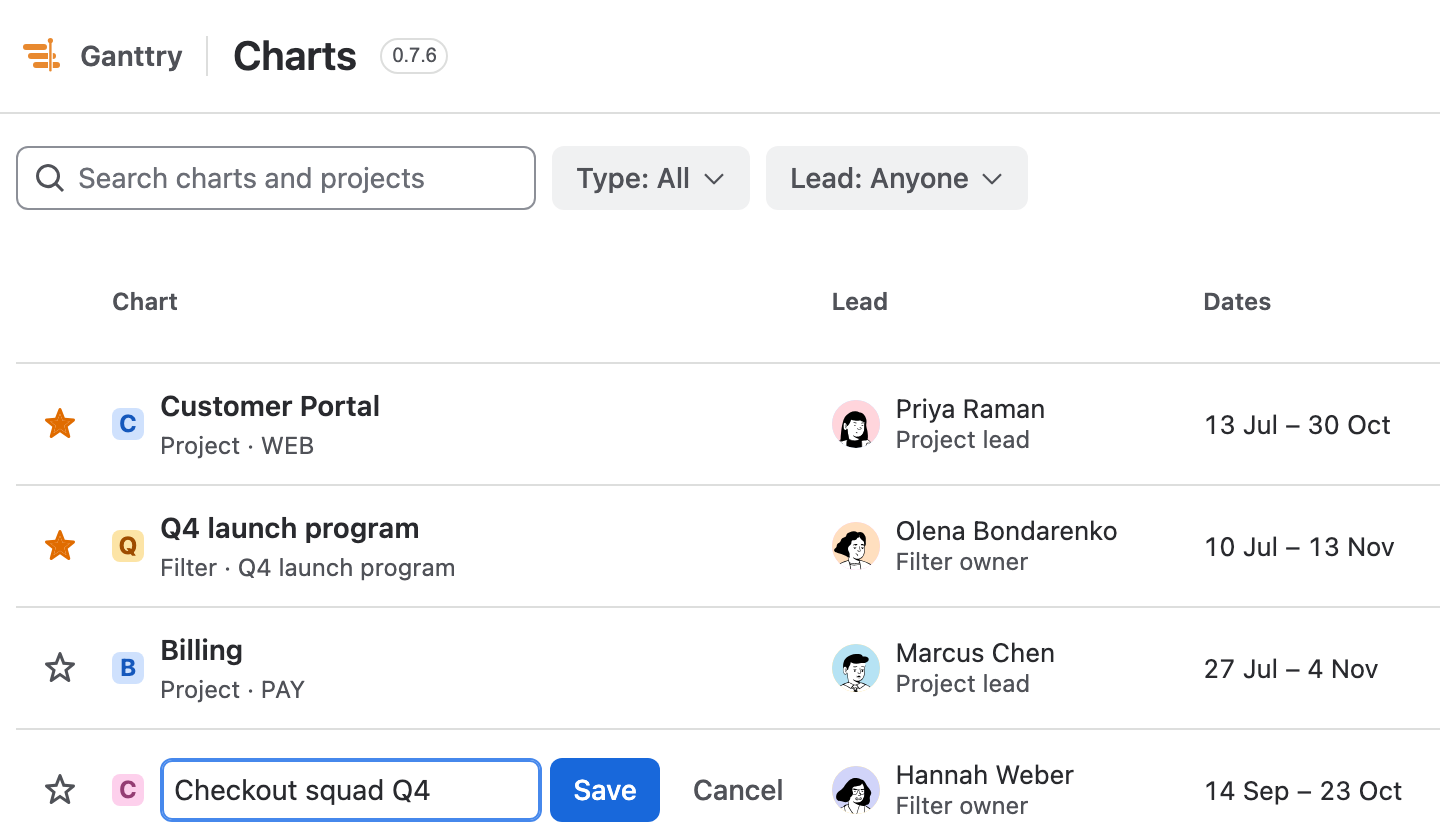
Rename it
Choose Rename in the row's menu, type the new name and Save. The name changes for everyone; the chart keeps its sources and its plan.
Step 5
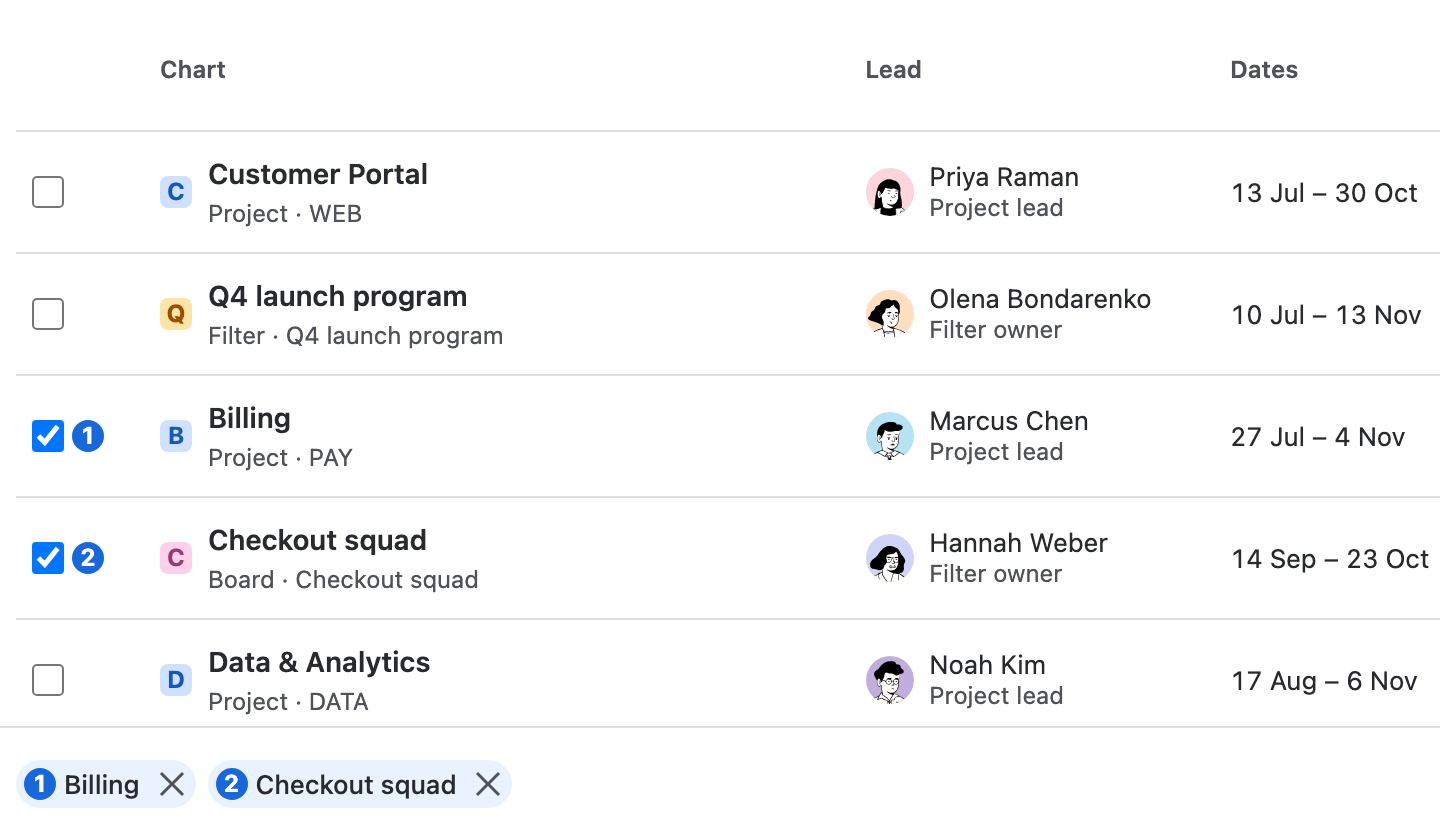
Combine charts
Choose New chart → Combine charts and tick two or three charts or projects. The order you tick is the order of the sections. Name the combined chart in the bar under the list and choose Create and open.
Step 6
Work in the combined chart
Each chart is a section with its own rows. A bar you move is saved to the chart it belongs to, and Publish goes chart by chart.
Good to know
- One list for everyone
- Everyone on the site sees the same charts. A chart is identified by its sources, so everyone who opens it works on the same plan, and a rename changes only its label. Stars are your own.
- Numbers without Jira requests
- Each row's dates, issue count, progress and overdue count come from a summary saved when someone opens the chart, so the list itself costs no Jira requests. A chart nobody has opened yet is counted from Jira once.
- One chart per project
- A new chart plans one project, so the project's page in Jira and Charts open the same plan. Charts saved earlier with several projects still open.
- Try it without touching Jira
- Sample plan opens about 1,000 generated issues that stay in your browser. Edits never reach Jira, and Reset the sample starts it again.
Read more in the docs
Ganttry for Jira Cloud