Your first chart
Open Ganttry, pick the work to plan and read the timeline. Charts, a project's chart, the header, bars and dates.
11 sections6 min readUpdated October 2026
Open Ganttry
Ganttry runs inside Jira. Where you open it decides where you land.
- From Jira's Apps menu, Ganttry opens on Charts, the list of every chart on your site.
- From a project's sidebar, Ganttry opens that project's chart straight away. Charts at the start of its header takes you to the list.
- Ganttry can also sit on a Jira dashboard as a gadget, in an issue's activity tab with that issue and the work connected to it, and on a Confluence page as a macro.
Pick a chart
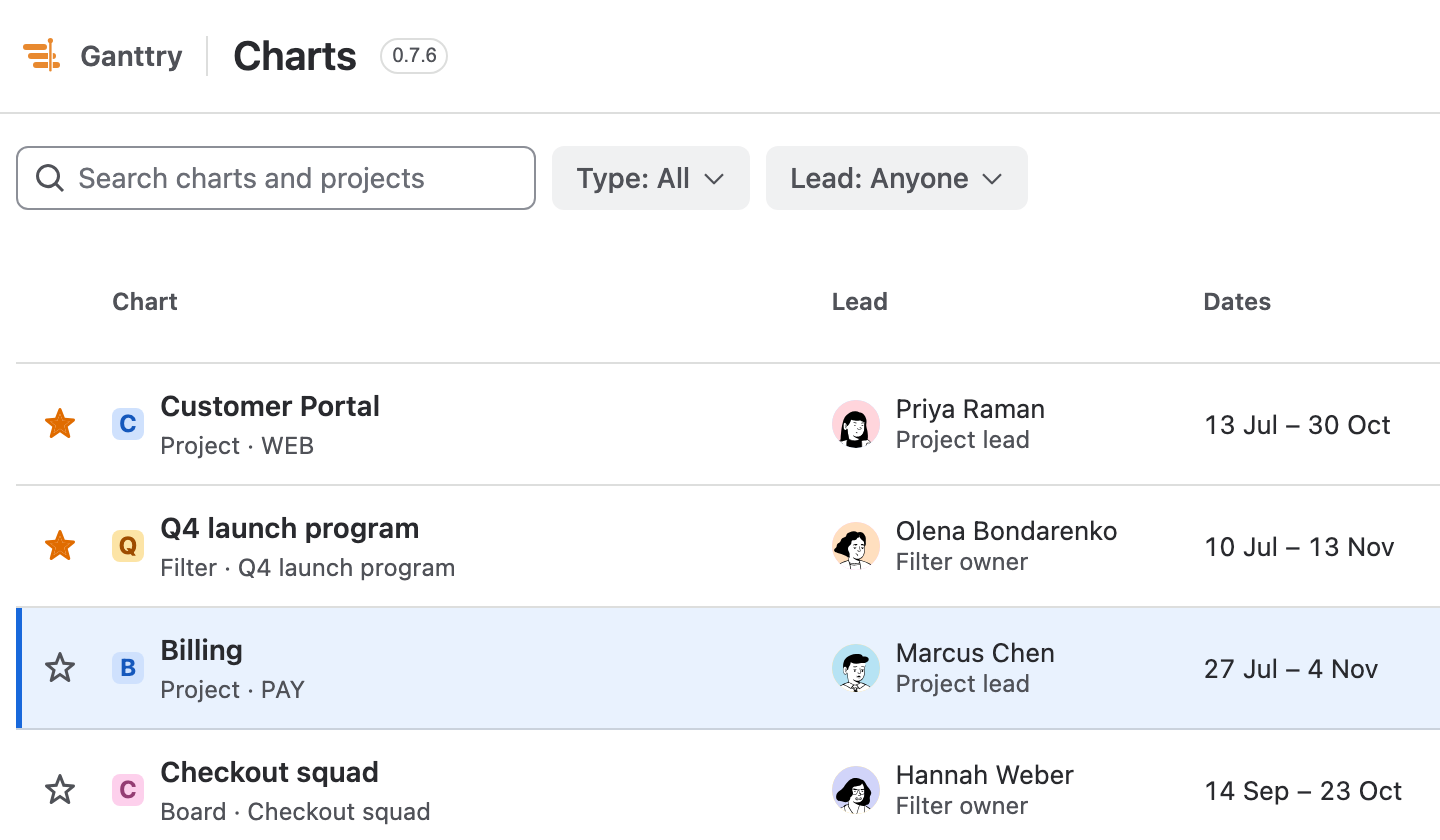
Charts lists each chart with its lead, dates, issue count, progress, overdue issues and last plan change. Starred charts come first, then the ones you opened last.
- Find the chart. Type in Search charts and projects, or narrow the list with Type and Lead.
- Click its row to select it and choose Open. A double-click or Enter opens it too.
- If your project has no chart yet, it is listed under Not planned yet. Open it and Ganttry saves the project's chart under its name and opens it.
Or try the sample plan
Sample plan at the top of Charts opens a generated plan of about 1,000 issues with epics, sprints, releases, dependencies and assignees. It runs only in your browser, so nothing you change there reaches Jira. Reset the sample starts it again, and Plan your own Jira work returns to Charts.
While the chart loads
An orange line along the top of the page fills as issues arrive, with the count once Jira reports the total. The chart appears when every open issue is read. Issues finished in the last two years follow in the background and are added without moving the chart.
If Jira asks Ganttry to slow down, every chart and tab on your site waits together, and the status line says how far loading has got. If it says issues were left out, Plan → Fetch the rest reads them.
The header: where you are
Every chart has one header row. Its left side says where you are and how the rows are arranged.
- Charts returns to the list.
- The chart's name opens a searchable list for switching to another project, board or saved filter in one click.
- The branch, Main at first, opens the scenario tree, where you try changes away from the main plan.
- Group arranges the rows by the Jira hierarchy, or by assignee, project, status, release, sprint, team, issue type or a custom field.
- Filter narrows the rows with quick filters, such as the work assigned to you, and by a range of planned dates.
- Search, or the / key outside a text field, finds issues by key or summary.

The header: what you can do
The right side of the header holds the actions. Below 900 pixels wide the header takes two rows, and below 760 pixels Plan and Share show only their icons.
| Control | What it holds |
|---|---|
| Plan | Baselines, Fetch the rest, Completion probability, Time in status, the risk register, Ask Rovo, priorities and OKRs, the portfolio hierarchy, the Program board, Activity and governance, Reset changes, and Back up and restore. |
| Share | The board link, a link to your current view, the Executive Summary, the Status report and every export. |
| Changes not in Jira | How many plan changes are waiting to be published. On a branch it counts the changes from its parent instead. |
| Undo | Takes back your last plan change. |
| Publish | Opens a review of the dates to write to Jira. Only the issues you tick are written. |
| Help | How to use Ganttry, Keyboard shortcuts, the Accessible task table and What's new. |

Board, timeline and panels
- The Board table on the left lists the issues with their key, summary, assignee, status and dates. Drag its edge to resize it, or fold it away to see only the timeline.
- The timeline on the right draws each issue as a bar on a calendar of UTC days.
- The dock at the bottom of the timeline holds Today, the scale menu with Days, Weeks and Months, zoom, Fit and New note.
- Plan insights opens from the right edge with its Dependencies, Delivery, Change history and Notes tabs. Workload opens from the bottom.
Read the bars
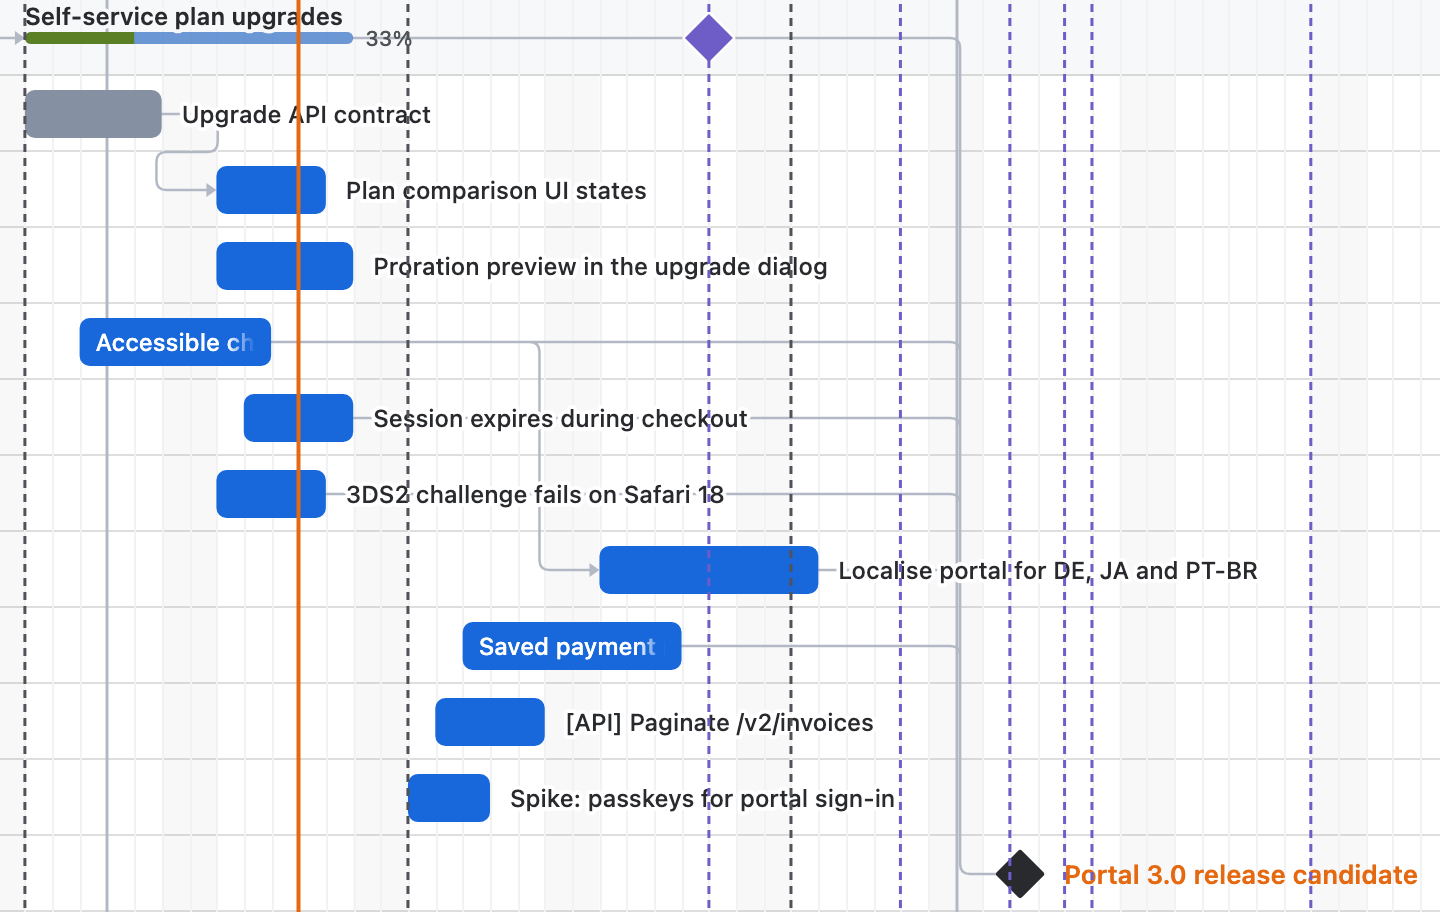
A bar runs from an issue's start to its end. Its colour says what state it is in, and hovering a coloured bar adds a line that says what the colour means.
- Blue: open work.
- Grey: done.
- Orange: late, because it finishes after its due date. When the whole label fits inside, it adds how many days late.
- Red: on the critical path, when the critical path is turned on.
- A parent issue is a slim track under its name: green for finished work, pale blue for work in progress, followed by the share done.
- A diamond is a milestone, an issue with no duration.
- The orange vertical line is today.
Where dates come from
Ganttry plans from Jira's start and due dates, estimates, dependencies and working time. A due date is the last day of the work, so an issue that starts on Monday and is due on Friday runs Monday to Friday. An issue with only a due date is placed to finish on it. Dependencies can push work later; a due date the plan cannot meet stays visibly late.
In the Board, a date that Ganttry calculated is marked ~. On the timeline, a thin light line just inside a bar's end means Jira has no date for that end, and hovering the bar names the date that is not set.
An issue with no Jira dates stays an empty row until you place it: hover a day in its row and click the preview, or choose Set dates in its row menu.
How long a bar is
Ganttry takes the first of these that the issue has, measured in working time. A finished issue is placed by its resolution date.
- The span between its Jira start and due dates.
- Its time estimate. An estimate of zero makes it a milestone.
- Its story points, at one working day per point.
- One working day.
Your changes stay in Ganttry until you publish
Moving or resizing a bar, or placing an undated issue, changes Ganttry's plan, not Jira. The header counts the changes not in Jira yet, Undo takes back the last one, and Publish writes dates to Jira only after you review them and tick the issues to change.
Some edits are Jira edits made as you, straight away: changing an issue's status or assignee, for example, or drawing a link between two issues.
Stuck on something this guide skips? Write to the developers →