Charts and combined charts
Find, create, rename and combine the charts on your site. The Charts list, New chart, projects not planned yet, combining charts and the sample plan.
11 sections7 min readUpdated October 2026Writes to Jira: Start and due dates, when you publish a combined chart
The Charts list
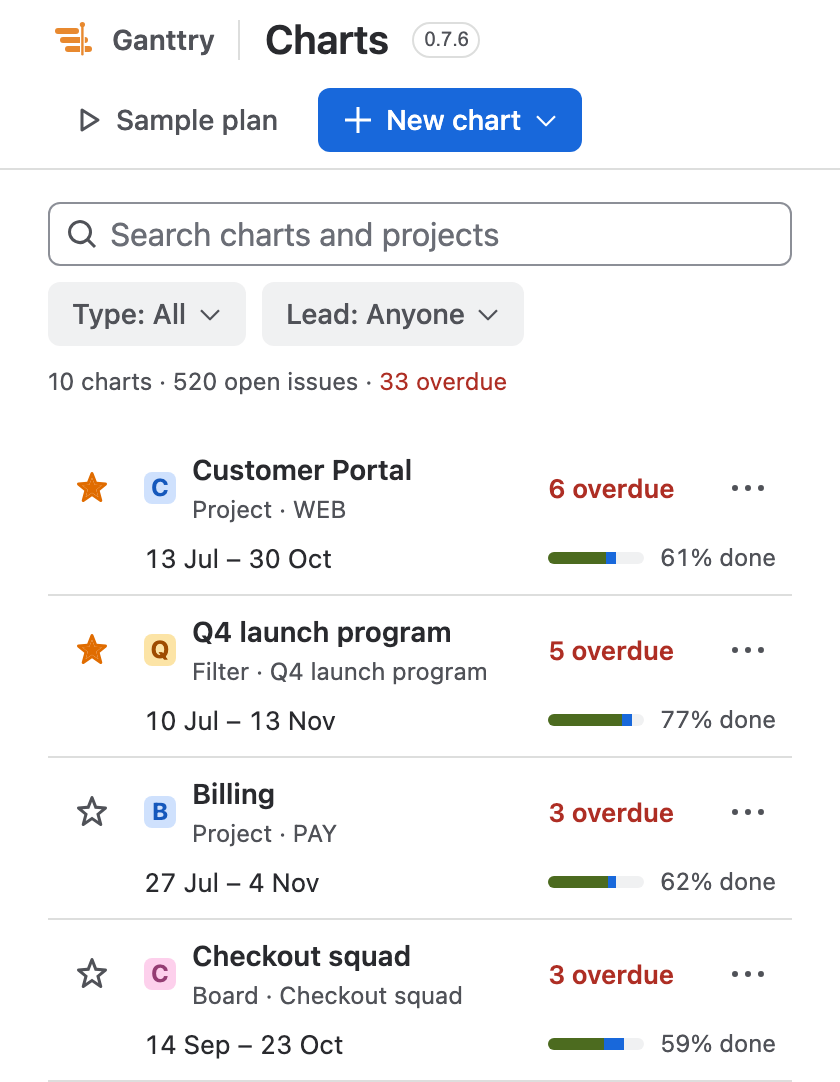
Charts is the page Ganttry opens on from Jira's Apps menu. It is one shared list of the charts planned on this Jira site, ten to a page. The line above the list adds up the charts, their open issues and their overdue issues.
Each row's dates, issue count, progress and overdue count come from a summary saved when someone opens the chart, so the list itself costs no Jira requests. A chart nobody has opened yet is counted from Jira once, three charts at a time. If Jira asks Ganttry to slow down, the row says Jira paused counting until it can count again.
| Column | What it shows |
|---|---|
| Chart | The name, over its type and source: Project · WEB, Board · Checkout squad, Filter · Security fixes, JQL with the query, or Combined with its charts. |
| Lead | The project lead, the filter owner, or the person who set the query. |
| Dates | From the earliest start date to the latest due date in the chart, or No dates yet. |
| Issues | How many issues the chart holds. |
| Progress | One bar split into done, in progress and to do, followed by the share done. |
| Overdue | Open issues whose due date has passed, in red. Empty when there are none. |
| Last plan change | Who last changed the plan, and how long ago. |
Find and open a chart
Starred charts come first, then the ones you opened most recently. Click the star at the start of a row to keep a chart at the top; your stars are your own.
- Type in Search charts and projects to match chart names. The projects under Not planned yet are searched too.
- Type narrows the list to Projects, Board, Filter, JQL or Combined, and Lead to one person. Clear filters resets the search and both filters at once.
- Click a row to select it, then choose Open in the row. A double-click or Enter opens it too, and the arrow keys move the selection.
- The row menu holds Open chart and Rename.
- Charts, a chart and the sample plan each have their own address, so the browser's Back and Forward move between them and a reload stays where you are.
Projects not planned yet
Under your charts, Not planned yet lists the projects you can see that no chart plans. It shows five at first; Show all projects lists the rest, and Show more reads further pages from Jira.
Open a project with a click and Open, a double-click or Enter. Ganttry saves the project's chart under the project's name and opens it, so a project needs no create step. The project's own page in Jira opens the same plan. When the site has no chart yet, Charts leads with this list and the sample plan.
A chart plans one project. Charts saved earlier with several projects still open.
Create a chart from a board, filter or query
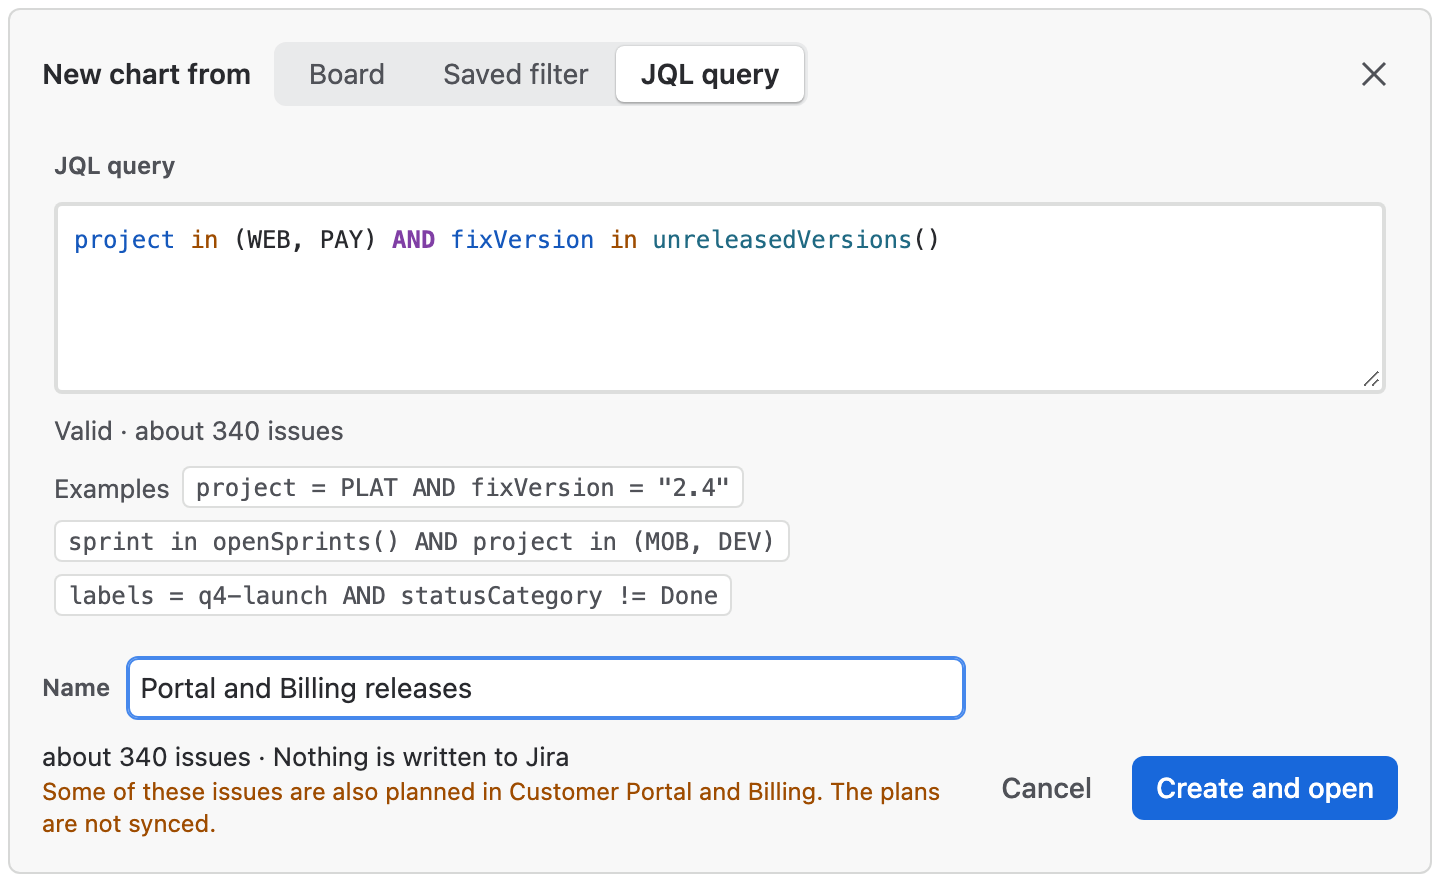
- Open New chart and choose Board, Saved filter or JQL query. A panel opens above the list; the switch at its top changes the kind of source.
- For a board or a filter, search by name and pick one. Each list shows ten at a time and Show more reads the next ten from Jira. Boards are listed through the filter Jira keeps for each board, so a board and its filter share one plan; a board whose filter was renamed is found under Saved filter.
- For a query, type the JQL. Jira checks it as you type and answers Valid with an approximate issue count, or says why it does not accept it. The Examples fill in a starting query.
- Check the Name, which starts as the board's or filter's name, or as JQL: and the query, then choose Create and open. The chart joins Charts for everyone and opens.
Rename a chart
A chart is identified by its sources, not its name. Renaming changes only its label: the plan, scenarios and notes stay with it, and the new name is saved for everyone.
- Open the row menu at the end of the row and choose Rename.
- Type the new name in the field that replaces it in the row.
- Choose Save or press Enter. Cancel or Escape keeps the old name.
Combine two or three charts
A combined chart shows two or three charts together, each as its own section. It is saved for everyone. You need edit rights in every chart in it, and Charts lists it only to people who can see every chart it contains.
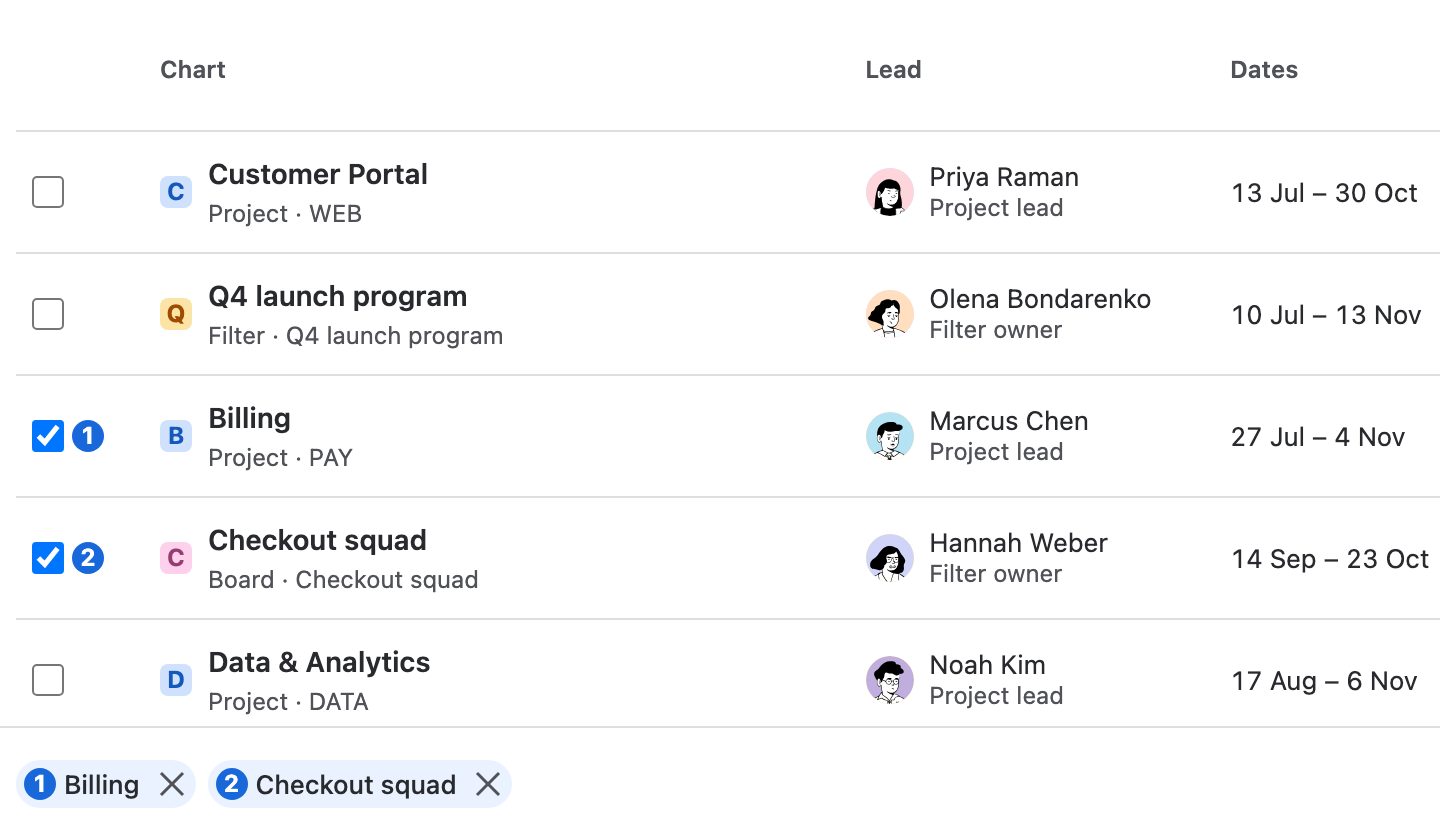
- Choose New chart → Combine charts. Ticks replace the stars.
- Tick two or three charts. Projects under Not planned yet can be ticked too; they are saved as their own charts first. The number beside each tick is its place in the order, which is the order of the sections.
- Name it in the bar under the list. The name starts as the charts' names joined with +.
- Choose Create and open. If the same charts are already combined, the button opens that chart instead. Cancel or Escape leaves without saving.
Combined charts in the list
Charts shows a combined chart as Combined with its charts' names and tiles, and adds up their numbers. The arrow beside its name expands it to each chart's own row, which opens that chart on its own.
Its row menu holds Rename, Change charts and Delete. Change charts opens the same choice with its charts ticked, and Save charts keeps the new set. Delete asks in the row first; the charts it shows and their plans stay, and nothing changes in Jira. A combined chart holds no plan data of its own, so none of these moves any.
How a combined chart works
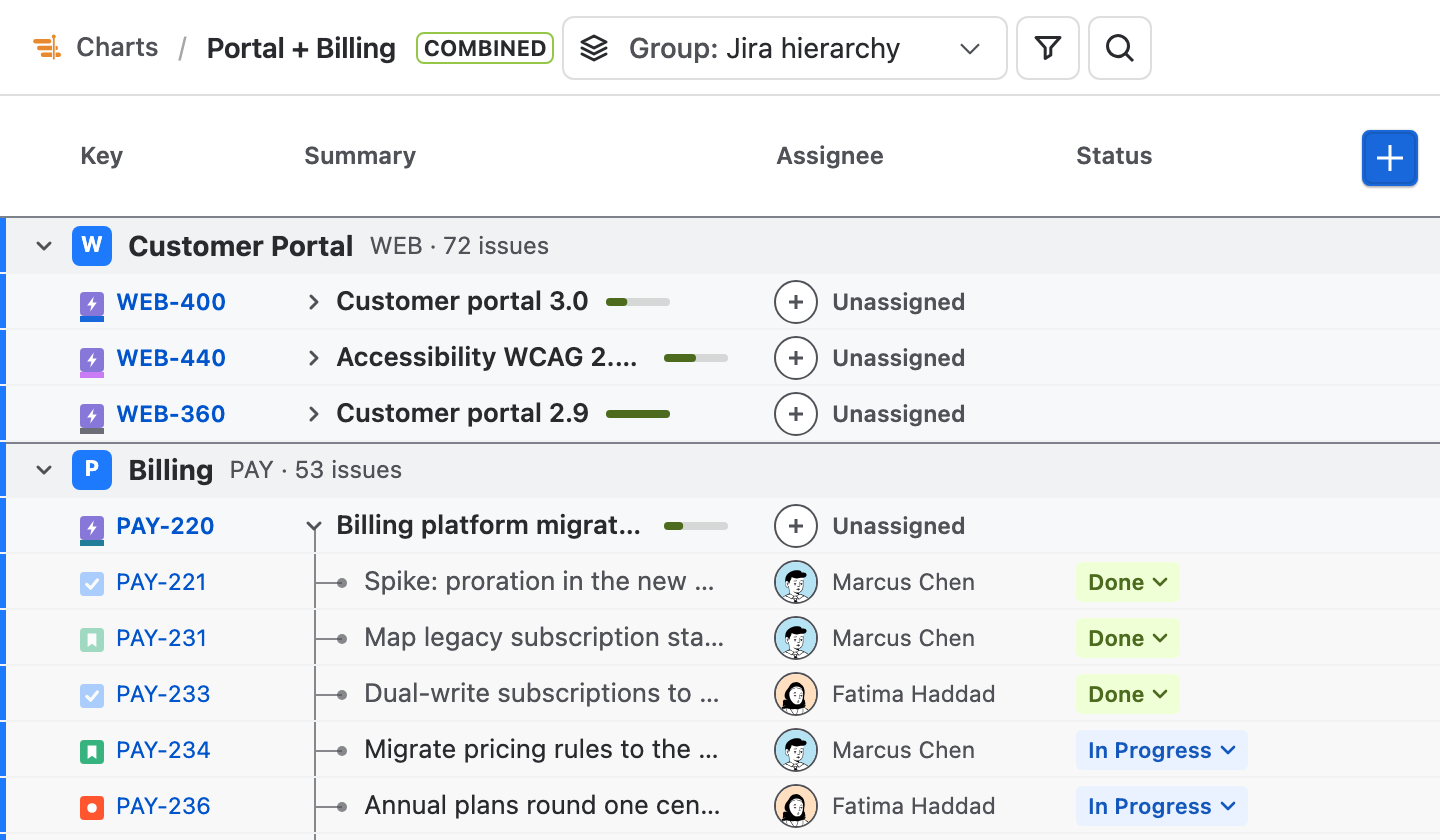
Opening a combined chart reads each chart with its own source and schedules each one on its own, so every issue keeps the dates it has in its own chart. A Combined label sits beside the name in the header. If one chart cannot be read, the others open with a notice.
| In a combined chart | What happens |
|---|---|
| Scheduling | Each chart keeps its own calendar, people, scheduling mode, constraints, allocations and teams. |
| Moving a bar | The move is saved to the chart the row belongs to. |
| Status, assignee, versions, new and deleted issues | Each goes to the chart that holds the issue or project. |
| Links between two charts | They move no dates; a broken one shows as a violation. Linking or unlinking issues of two charts is not offered. |
| Notes | Each chart's notes show together. A note is saved to the chart that holds it, and a period band stays within its own chart's rows. |
| Other people | Anyone with one of its charts open sees your saved moves and presence, and you see theirs. |
| Plan insights | Delivery groups releases and milestones by chart. The dependency map and completion probability are available. |
| Kept with each chart | Scenarios, baselines, Reset changes, markers, change history, backups, MS Project export, saved views, Jira columns, link types and waits, scheduling constraints, Workload settings and the plan-editing tools are hidden. |
Publish a combined chart
Publish lists each chart's changes under that chart, then publishes chart by chart, each through its own publish. A chart that fails leaves the others to publish. Pause stops before the next chart, and Retry failed, Resume and Undo act on every chart.
After the dialog closes, undoing the publish reverts only this combined chart's last publish, as remembered in this browser.
The sample plan
Sample plan, at the top of Charts, opens a generated plan of about 1,000 issues with epics, sprints, releases, dependencies and assignees. It runs entirely in your browser: edits stay there and never reach Jira or the site's shared plans.
A banner under the header keeps Reset the sample, which restores the plan, and Plan your own Jira work, which returns to Charts.
Charts on a narrow screen
Below 720 pixels wide, each chart takes two lines without sideways scrolling: its name, source and dates, then its overdue count and progress, with the row menu at the end. The lead and issue count are left out, and the header and filters wrap.
Stuck on something this guide skips? Write to the developers →