The chart: header, table and timeline
Know every part of a chart and what it shows. The one-row header, the Board table, bars and their ends, grouping, search, filters, saved views and zoom.
10 sections8 min readUpdated October 2026Writes to Jira: Changing status or assignee
The header
Every full-page chart has one header row. The left half says where you are and how the rows are arranged; the right half holds the plan's menus and the way to Jira.
| Control | What it does |
|---|---|
| Charts / chart / branch | Charts returns to the list of charts. The chart name opens a searchable list for switching to another project, board or saved filter. The branch, Main by default, opens the scenario tree. |
| Group | Arranges the rows by Jira hierarchy, assignee, project, status, release, sprint, team, type or one of the chart's custom fields. |
| Filter and Search | Narrow the rows. Both are described below. |
| Plan | Baselines; Analyse, with completion probability, Time in status, the risk register and Ask Rovo; Organise, with priorities and OKRs, the portfolio hierarchy and the Program board; then Activity and governance, Reset changes and backups. |
| Share | The board link, a link to your current view, the Executive Summary, the Status report and every export. |
| Changes not in Jira | How many plan changes Jira does not hold yet, such as 14 changes not in Jira. On a branch it counts the changes from its parent instead. |
| Undo | Reverses your last plan change. |
| Publish | Opens the review of date changes before anything is written to Jira. Its arrow holds Undo publish. |
| Help | How to use Ganttry, Keyboard shortcuts, the Accessible task table and What's new with the version. |
The Board table
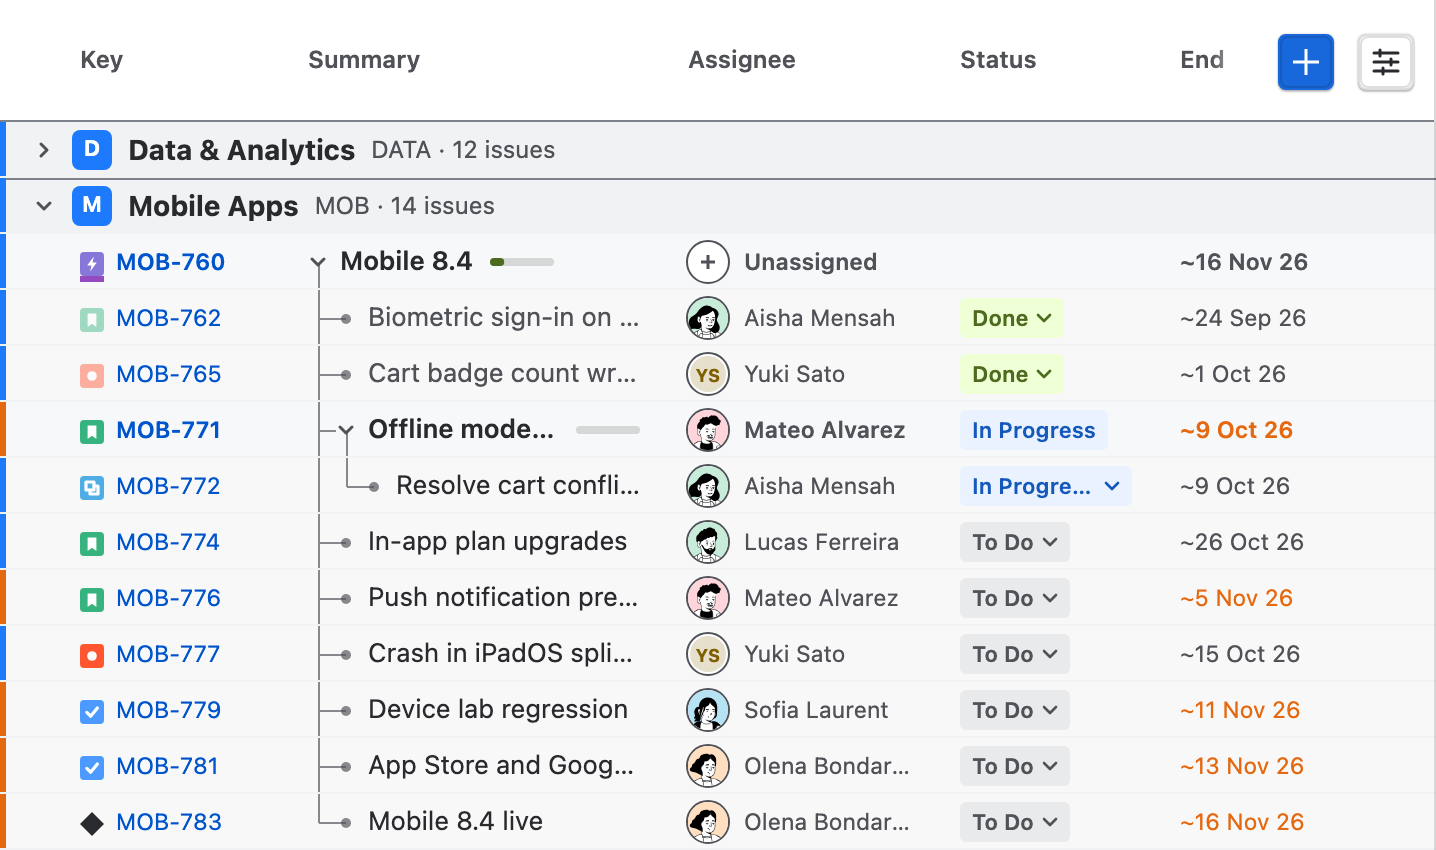
The table on the left lists the issues in Jira order. On a chart of several projects each project has a section header with its tile, name, key and issue count; click it to fold the project. Parents fold and unfold with their chevron, and each parent shows a small bar of the share of its issues that are done.
Click a key to open the issue in Jira. The Status and Assignee cells open a menu of the transitions and people Jira allows; choosing one is a Jira edit made as you. Hovering a row outlines its bar on the timeline, and hovering a bar highlights its row.
Click a heading to sort by that column: ascending, descending, then back to Jira order. Drag the edge of a heading to resize a column, or double-click it to return to the default width. New issue and Columns sit at the right end of the header, and Create issue follows the last row.
Choose the columns
Columns lists every field the table can show, with a search. Ganttry's own columns are Key, Summary, Assignee, Status, Start, End, Duration and, when the chart has releases, Release. Each can be hidden and shown again.
Add Sprint, Team, Points, Slack, Done or Spent, and Slip once a baseline is drawn. Up to six Jira fields can be columns too; a Jira field named like one of Ganttry's columns is headed as a custom field. Your columns and widths are kept for you and travel in view links and saved views.
Read the bars
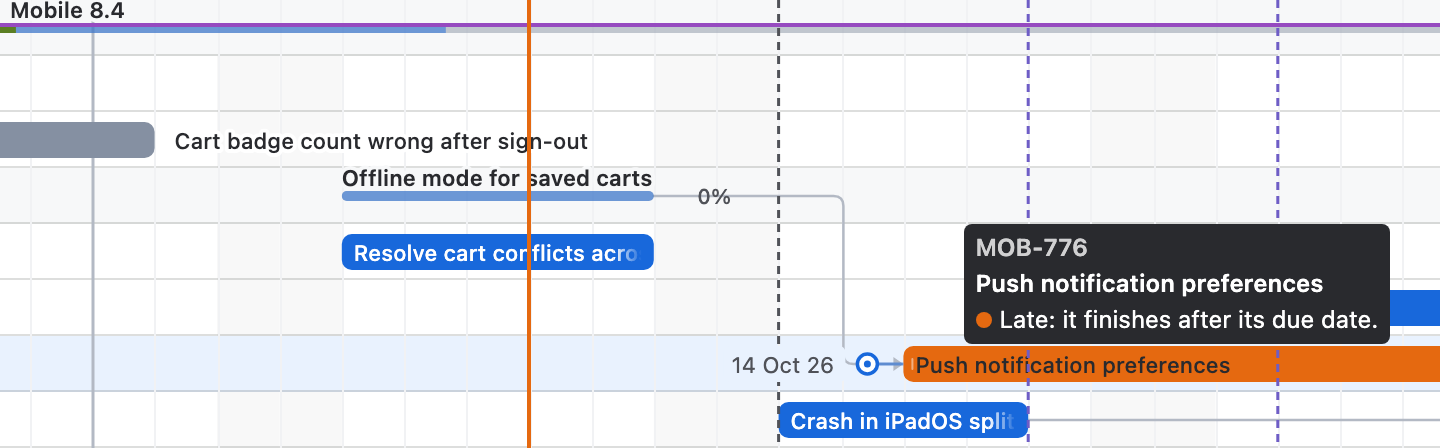
Each issue is a bar from its start to its end, with its name inside. When less than half the name fits, the name sits beside the bar instead. Hovering a bar shows its key, name and dates; on a coloured bar the tooltip adds what the colour means.
| You see | It means |
|---|---|
| Blue bar | Open work. |
| Grey bar | Done work. |
| Orange bar, or an orange End date | The work finishes after its due date. |
| Red End date with a warning icon | The End date has passed and the work is not done. The bar adds how many days late it is when that fits. |
| Red bar | On the critical path, when Critical path (zero slack) is on in Chart settings. |
| Name above a slim track | A parent. The track fills green for finished issues and pale blue for those in progress, followed by the share done. |
| Diamond on its own row | A milestone: work with no duration. |
| Diamond on a parent's track | The date of the parent's release. |
| Fine line inside a bar end | Jira has no date for that end. |
| Fine stripes across a bar | Dates you set in Ganttry that Jira does not hold yet. |
| Date marked ~ | A date Ganttry calculated rather than one that is set. See Scheduling and calendars. |
The timeline
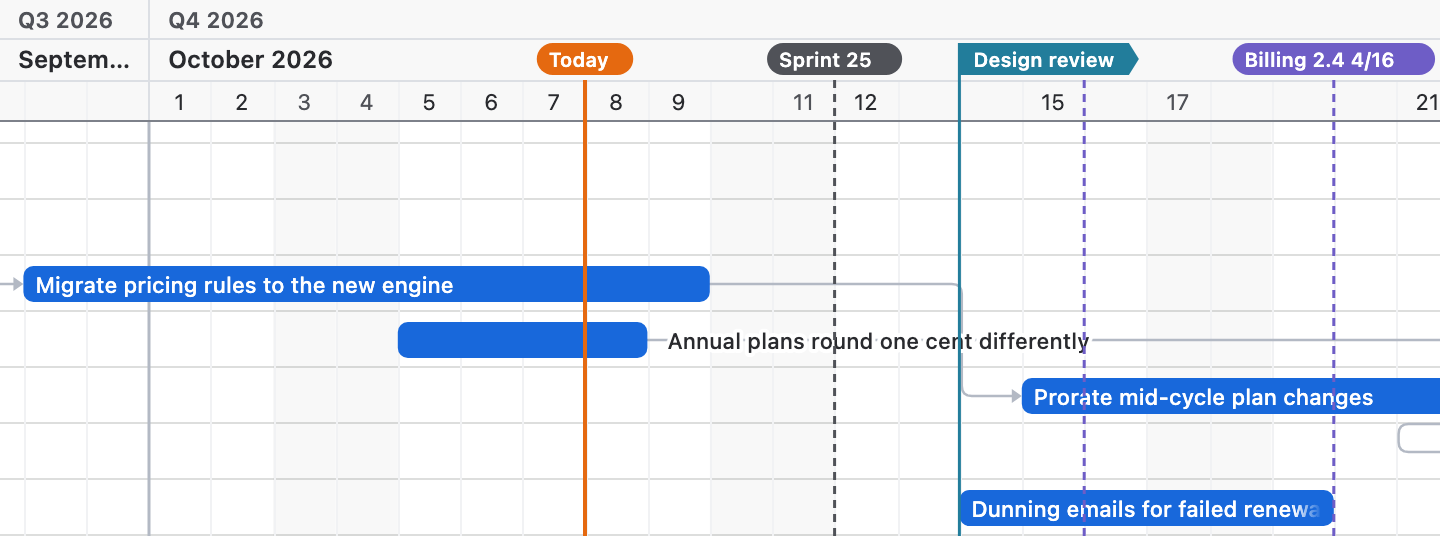
The date header names the quarter, the month and the days or weeks, and weekends are shaded. Today is the orange line. Each sprint start is a dashed line with the sprint's name, and each release date a dashed line with its name and how many of its issues are done, such as Billing 2.4 4/16.
Markers are your own dated lines, for a freeze, a review or a promise. Hover the date header and click the add button to start one on that day, right-click a day and choose Mark …, or open Chart settings → Markers to name, date, describe and remove them. A chart holds up to 12 markers, and they never reach Jira.
Group, search and filter
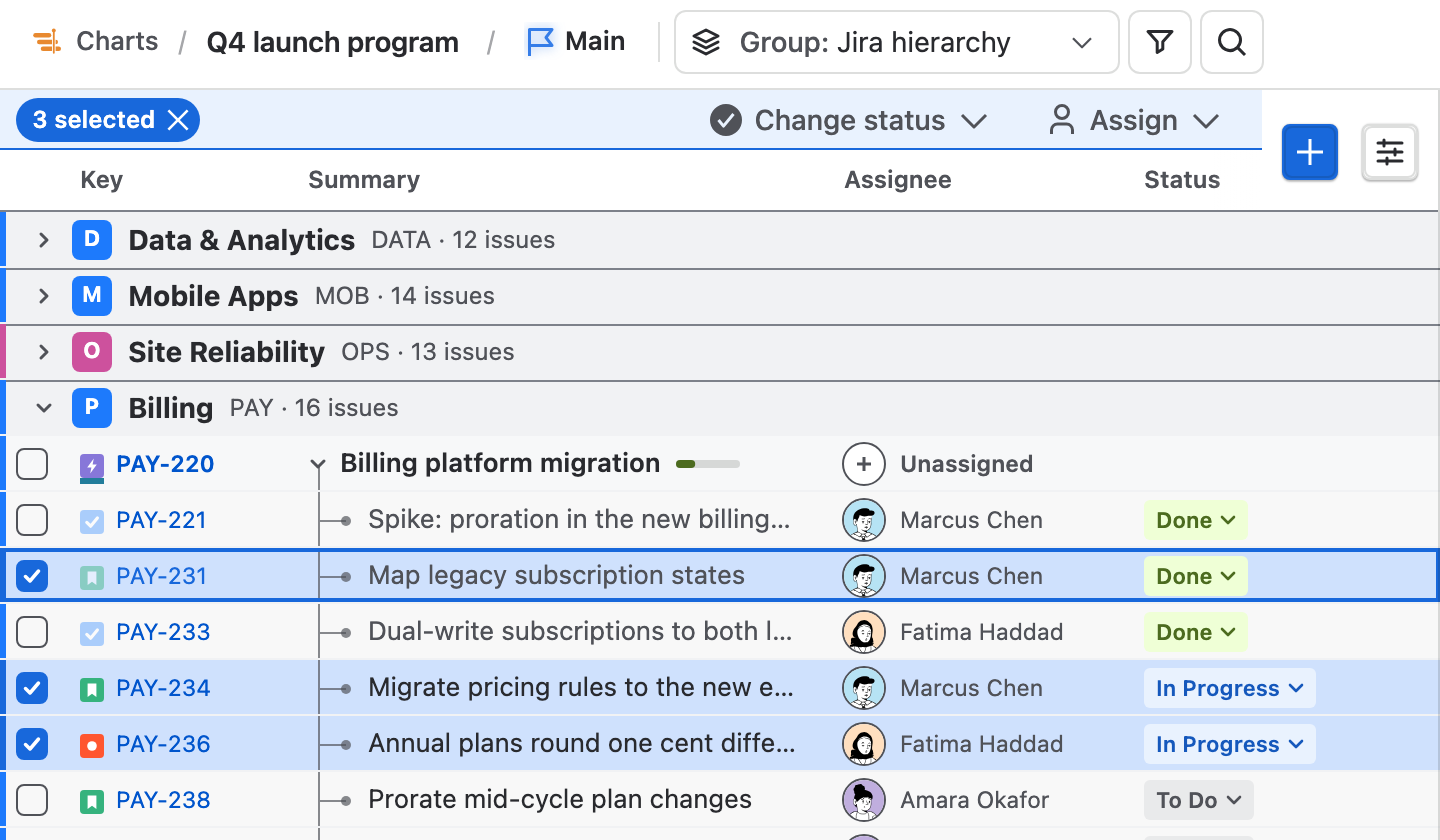
Grouped by sprint, each sprint row shows Jira's state and dates, and the active sprint is tinted. Grouped by team, an issue's team is its Jira Team field or, failing that, the Ganttry team of its assignee. Jira hierarchy brings back parents and children.
Press / or choose Search and type part of a key or summary. Matching issues stay with their parents. On a wide header the field stays open while it holds a search; the cross clears it.
Filter opens a panel with two tabs. The count on the button says how many conditions are on, and Clear removes them all.
| Tab | What it holds |
|---|---|
| Quick filters | Assigned to me, Unassigned, Not started, In progress, Done, Epics only, In a sprint and Needs attention, each with a count. Match sets whether an issue must meet all of them or any. |
| Date range | Planned dates Today, This week, Next 14 days or This month, or your own From and To. |
Select and act on several issues
Click a row to select it. To mark several, tick their checkboxes, Ctrl- or ⌘-click them, Shift-click to take a range, or press Ctrl/⌘+A for every row the filter leaves visible. Escape clears the marks.
While rows are marked, the selection bar sits above the headings with the count, Clear, Change status and Assign, and on a board chart Plan in Jira. Right-click a marked row to copy the rows, see their Time in status or reset their dates.
Change the plan
Drag the middle of a bar to move it, or one of its ends to change its length. Bars move a day at a time and keep at least one working day; the new dates show beside the bar while you drag, and holding it near an edge scrolls the timeline. Escape cancels the drag.
Each change is saved in Ganttry for everyone on the chart and counted in the header until you publish it. Undo reverses it. An issue with no dates is an empty row: hover a day in that row and click the preview to place it there.
- Right-click a row or bar for Open …, Change status, Assign, Add task note, Set dates or Edit estimate, Dependencies, Explain schedule, Reset dates or Remove from timeline, New issue and Delete issue.
- Right-click an empty day for Mark … and New issue on ….
Chart settings and saved views
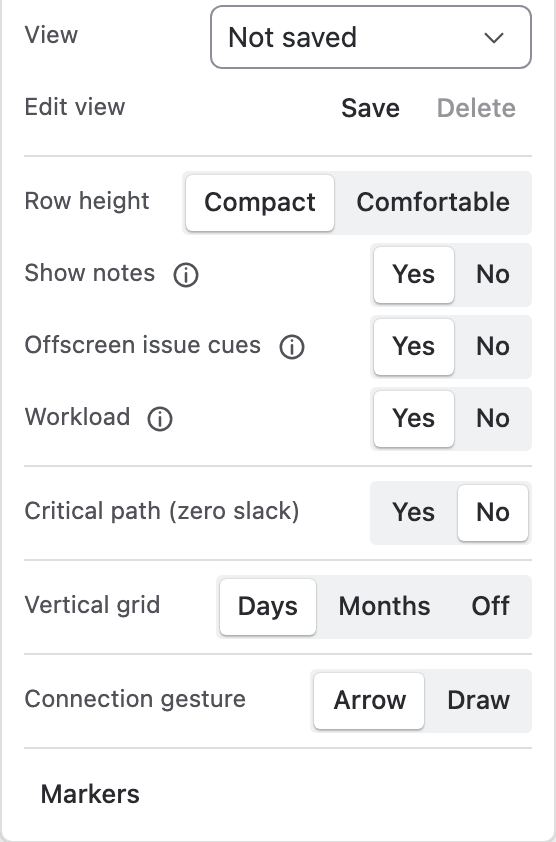
Chart settings is the button at the right end of the timeline header. View applies a saved view, and Edit view → Save keeps the current grouping, columns, sort, filters and zoom under a name for everyone on the chart. A view holds no dates. Delete removes the view on screen.
- Row height: Compact or Comfortable rows.
- Show notes, Offscreen issue cues and Workload: show or hide each one.
- Critical path (zero slack): colour the work that sets the finish date.
- Vertical grid: a line for every day, only at months, or none.
- Connection gesture: follow the pointer with an arrow, or draw links by hand.
- Markers: your own dated lines.
Stuck on something this guide skips? Write to the developers →