The Gantt chart
Every Jira issue on one timeline, from epic to sub-task.
Ganttry draws the issues of a project, board, saved filter or JQL query as a Gantt chart: the Jira hierarchy in a table beside the timeline, each issue as a bar, with sprints, releases and Today. Moving a bar changes the plan in Ganttry; Jira changes only when you publish.
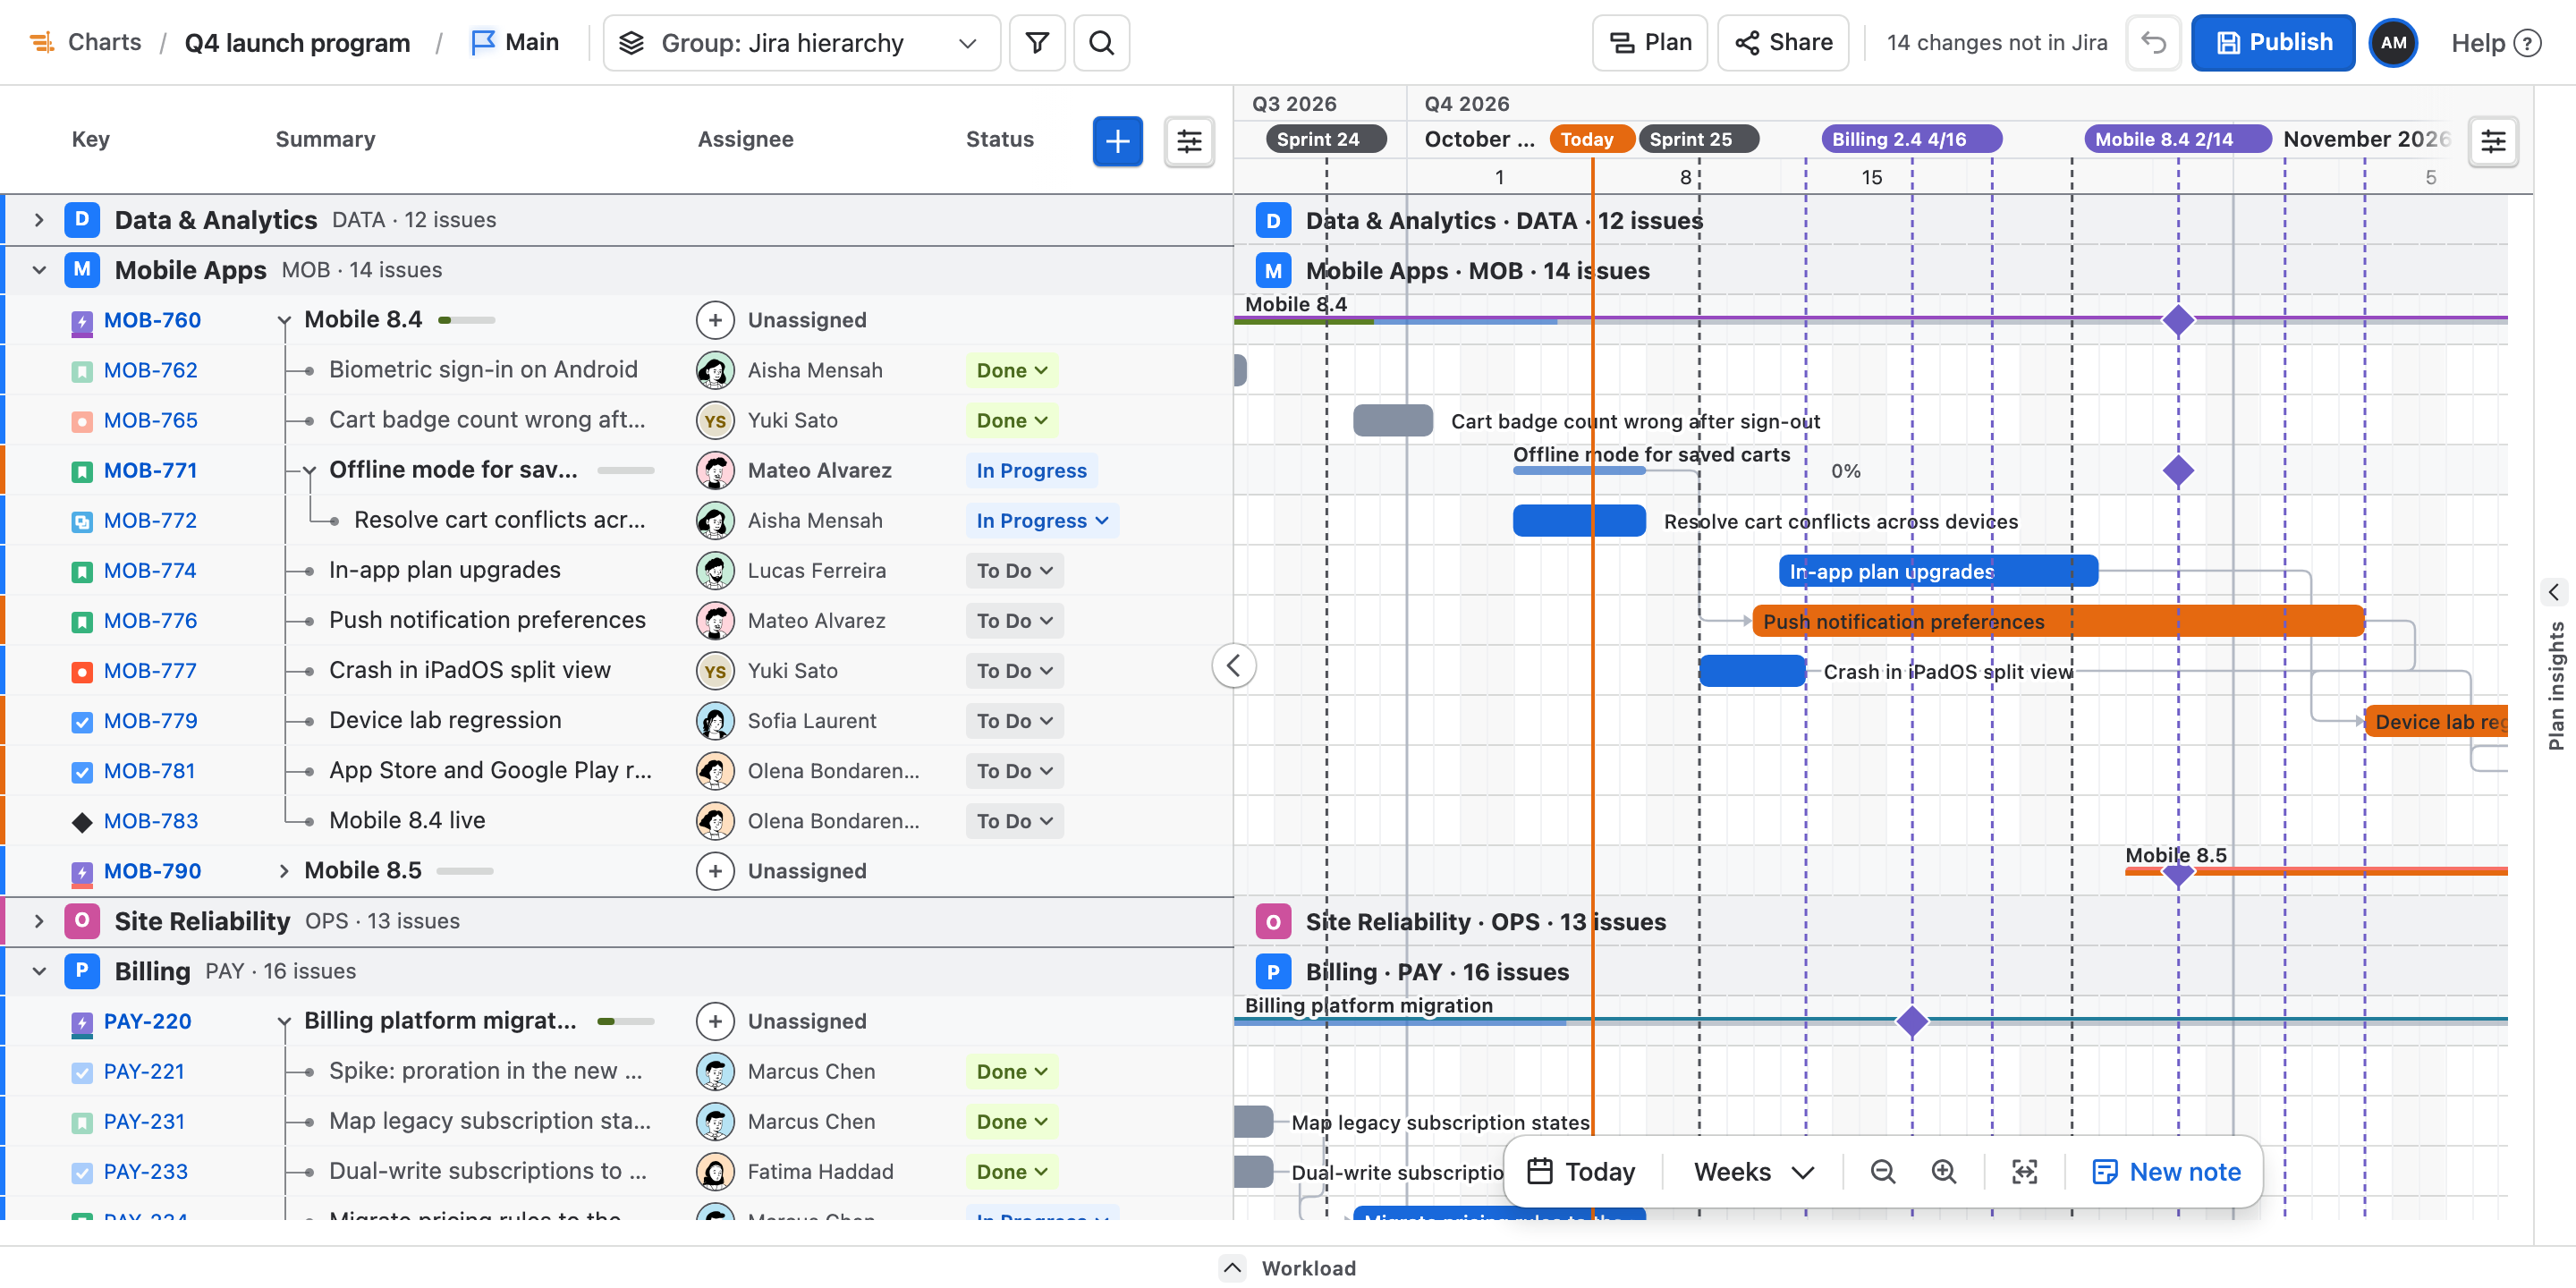
- Jira hierarchy with roll-up
- Sprints, releases and Today
- Search, filter and group
- Drag now, publish later
What you get
The Gantt chart, part by part.
01
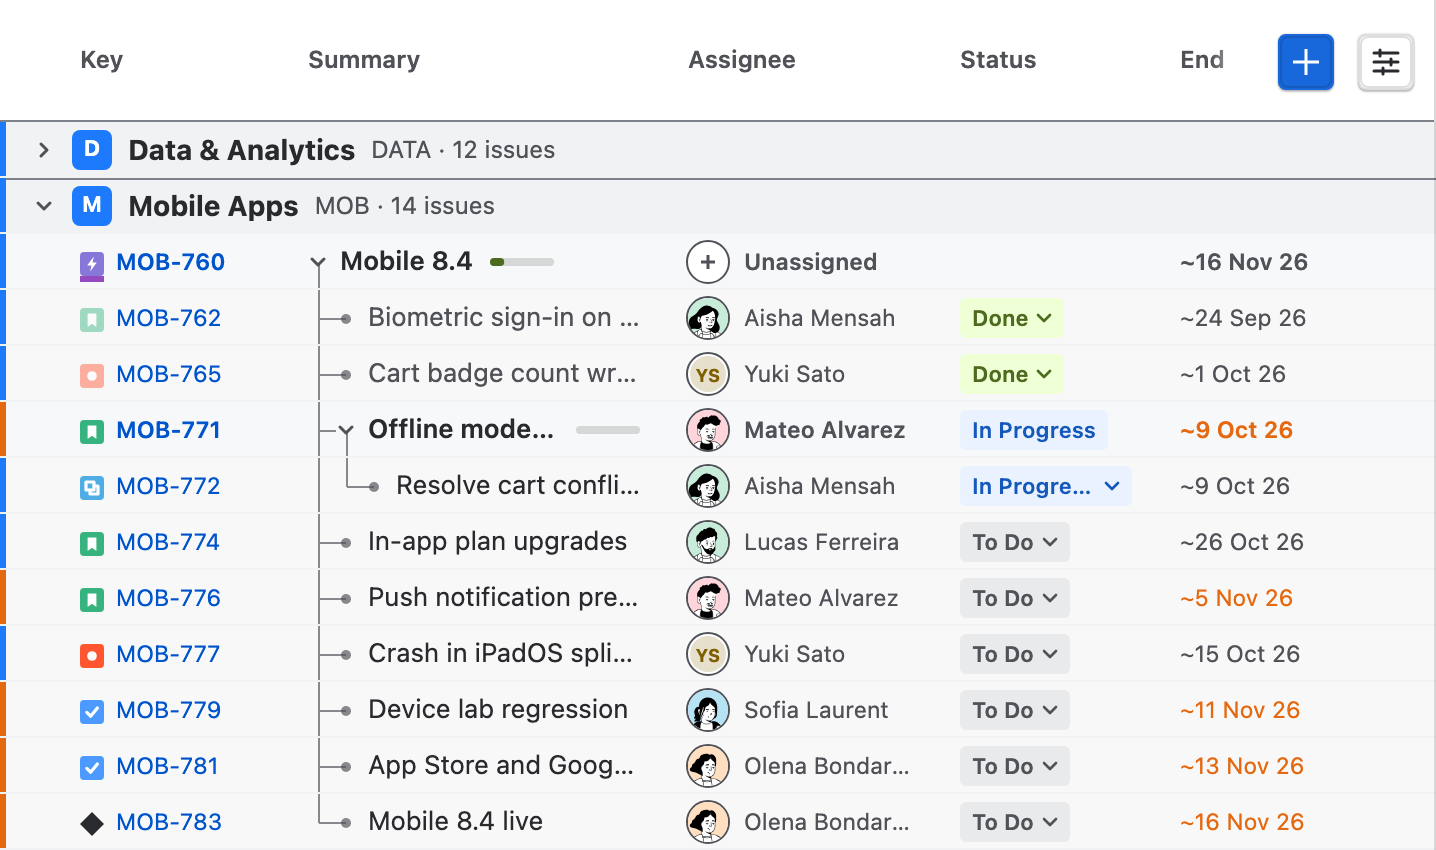
A table that is the plan
Key, summary, assignee, status and dates in columns you choose and size, with each parent's progress beside its name. Status and assignee change right in the cell, and a date marked ~ is calculated by Ganttry.
02
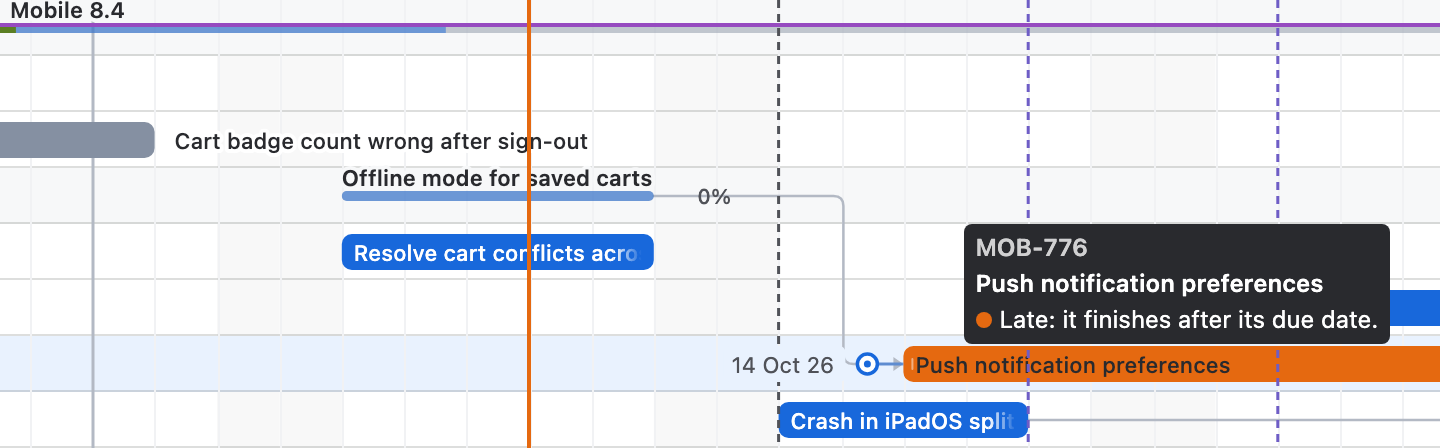
Bars that say what they mean
Blue is open, grey is done and orange finishes after its due date. A parent draws a track of its finished and in-progress work with the share done, and hovering a coloured bar says why it has that colour.
03
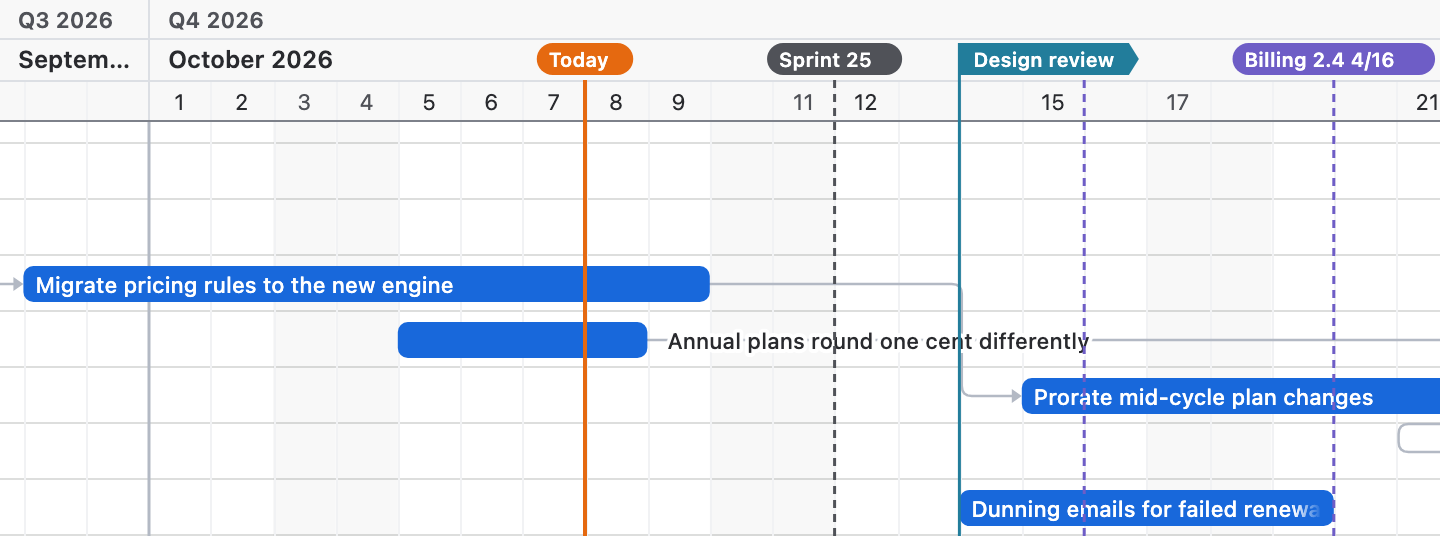
Sprints, releases and Today
Today, the start of each sprint and each release date run down the chart. A release shows how many of its issues are done, and your own markers, such as a design review, sit beside them.

04
Bars off screen stay in reach
Hover a row whose bar is scrolled out of view and a cue at the timeline edge names it. Hover the cue for its dates, or use its arrow to jump to the bar.
How to use it
From the first look to a changed plan.
Step 1
Choose how rows are grouped
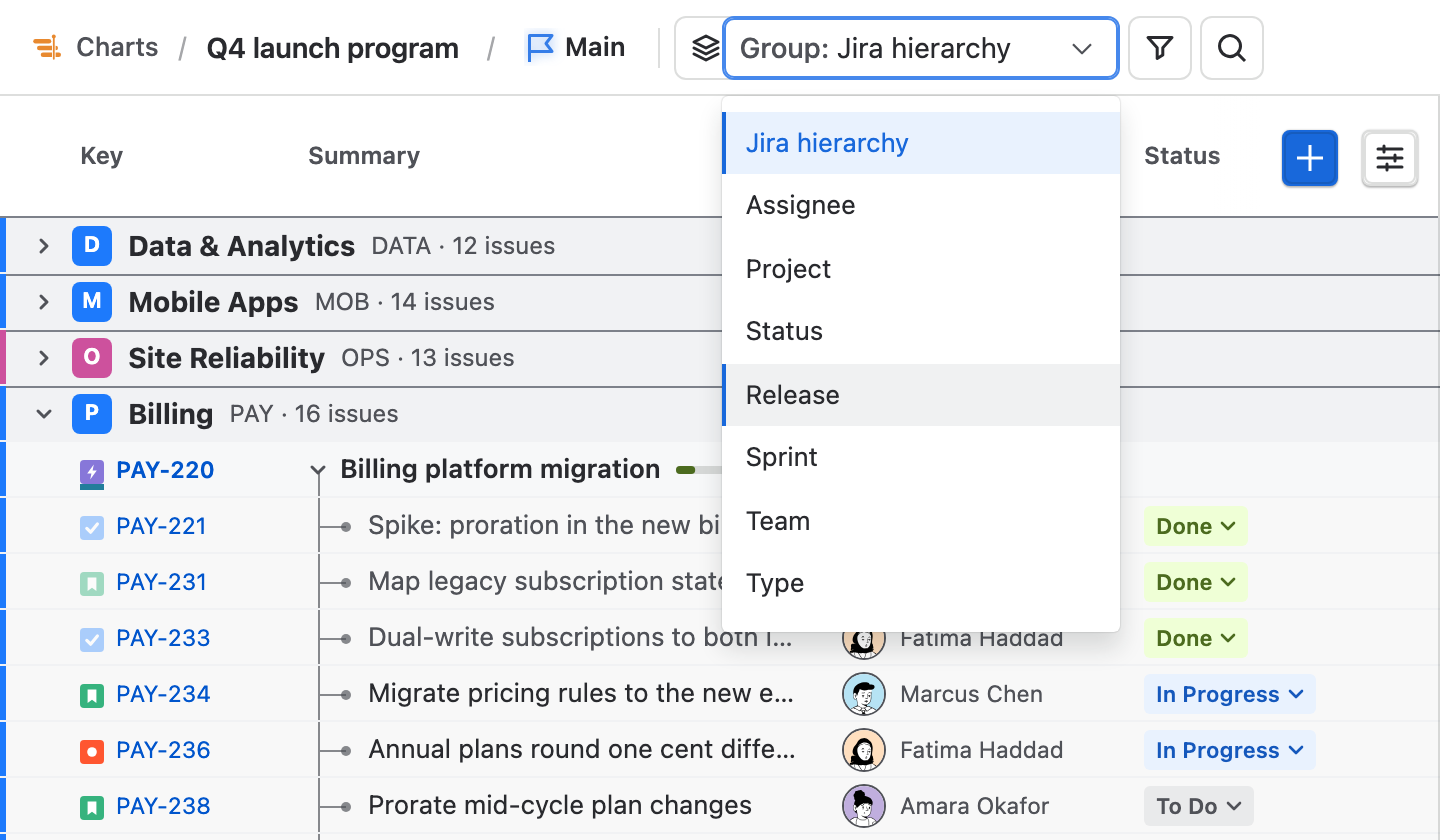
Open Group in the header and pick Jira hierarchy, Assignee, Project, Status, Release, Sprint, Team or Type. The chart's custom fields are listed too once they load.
Step 2
Find an issue
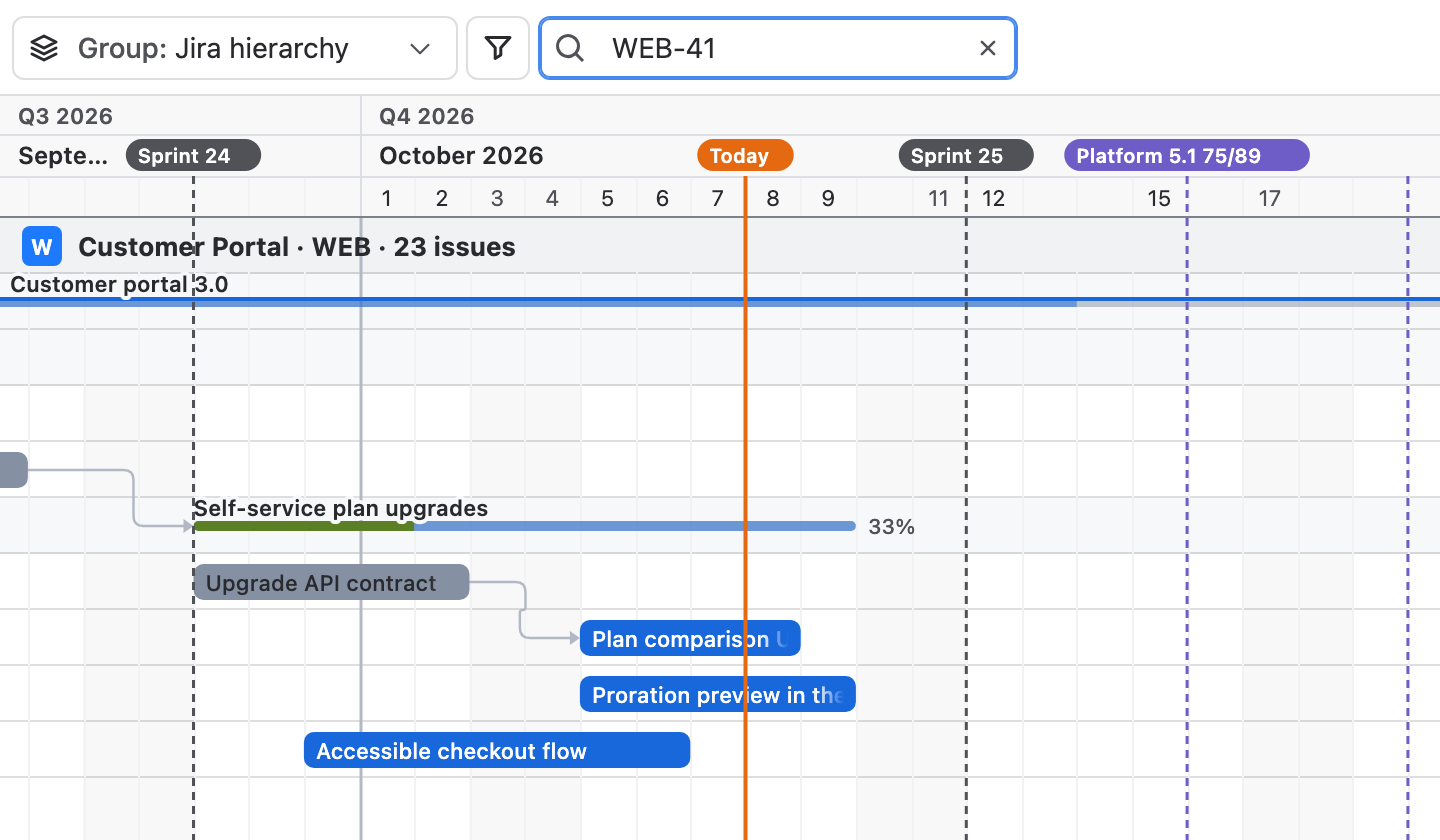
Press / or choose Search and type part of a key or summary. The issues that match stay on the chart with their parents; clear the field to bring the rest back.
Step 3
Narrow it down
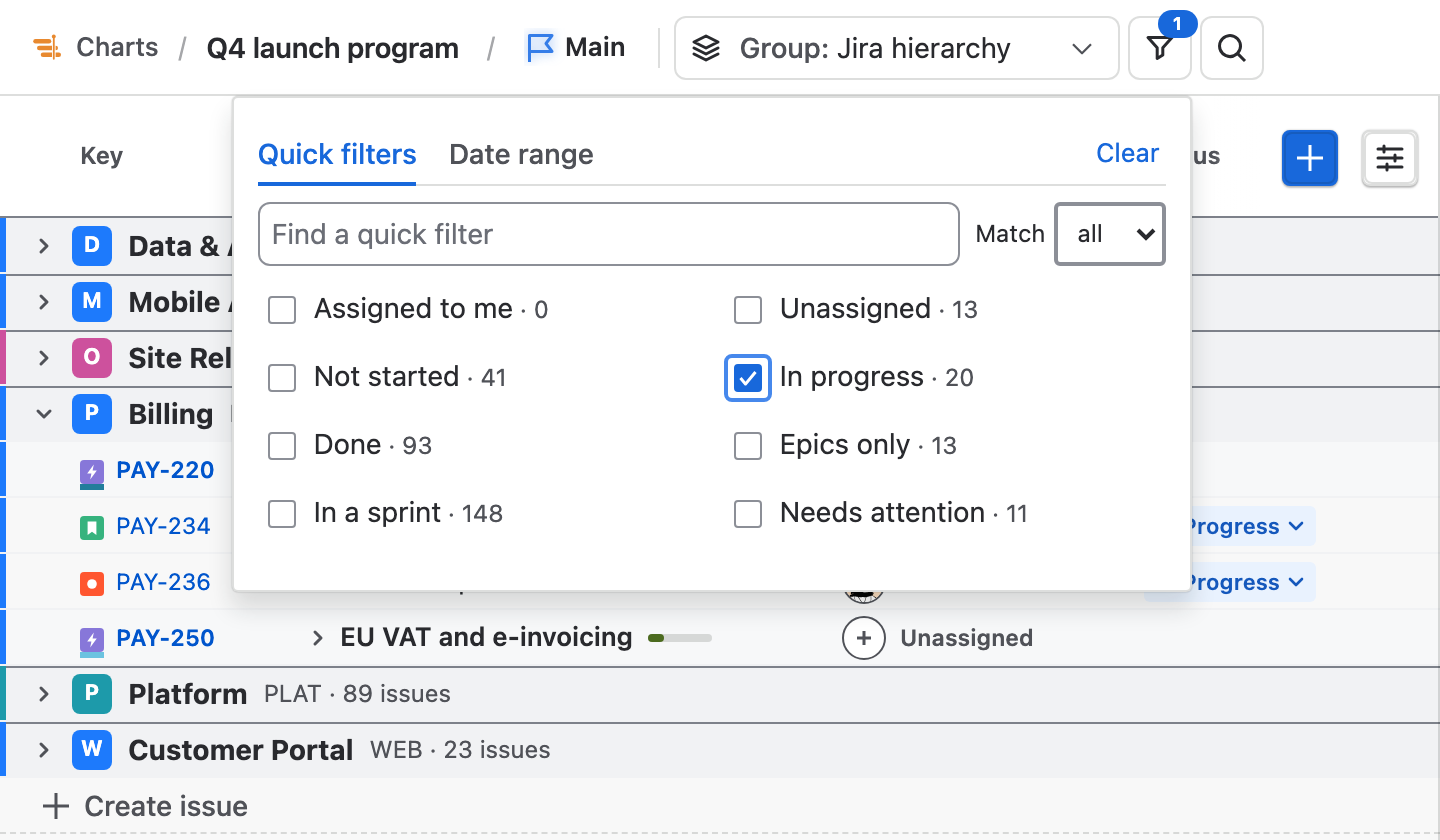
Filter holds Quick filters such as In progress, Assigned to me and Needs attention, each with how many issues it matches, and a Date range for planned dates. The count on the button says how many are on.
Step 4
Set the scale
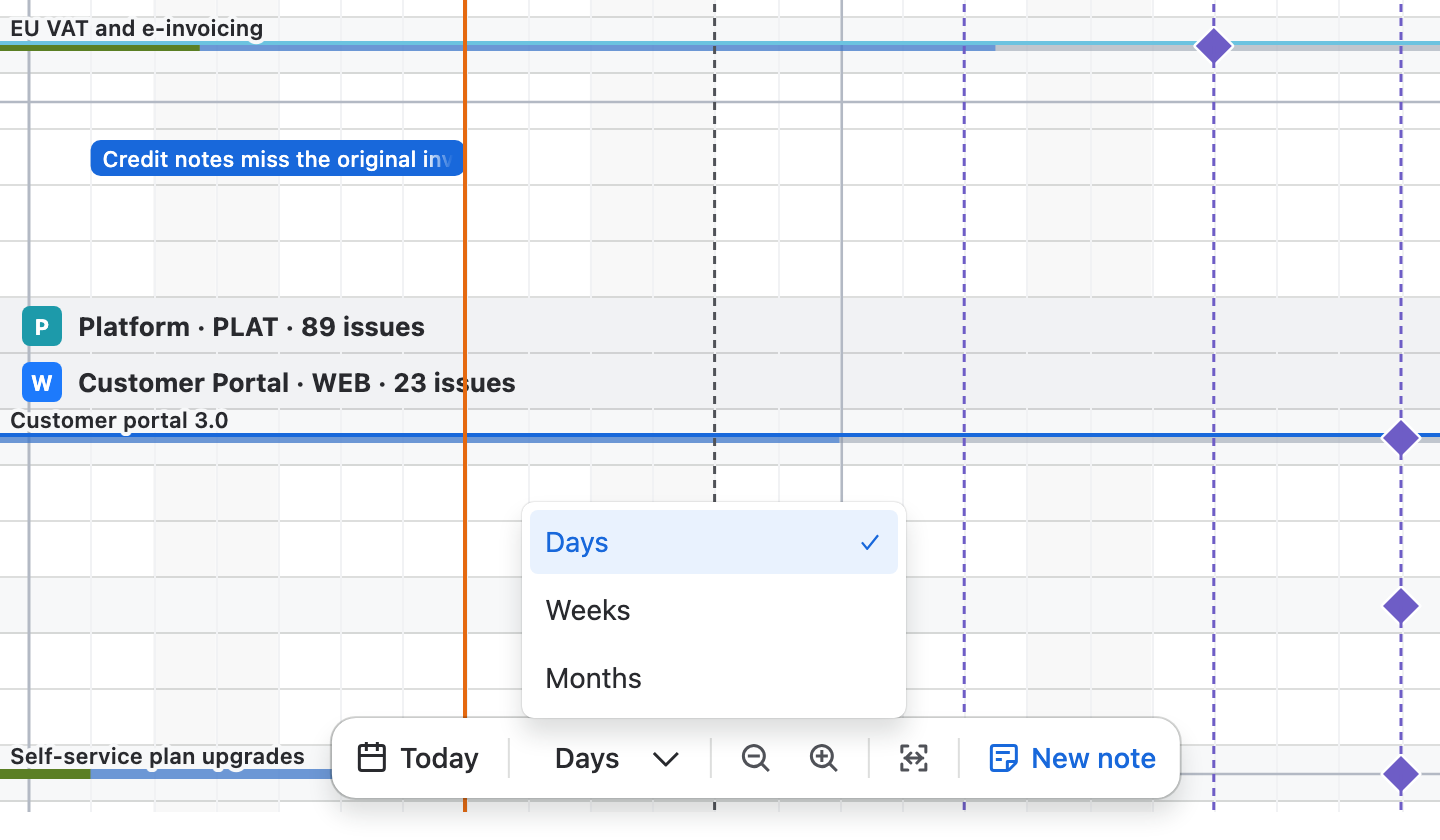
The dock at the bottom of the timeline holds Today, the scale menu with Days, Weeks and Months, zoom out and in, and Fit, which shows the whole plan even when it runs for years.
Step 5
Move or stretch a bar
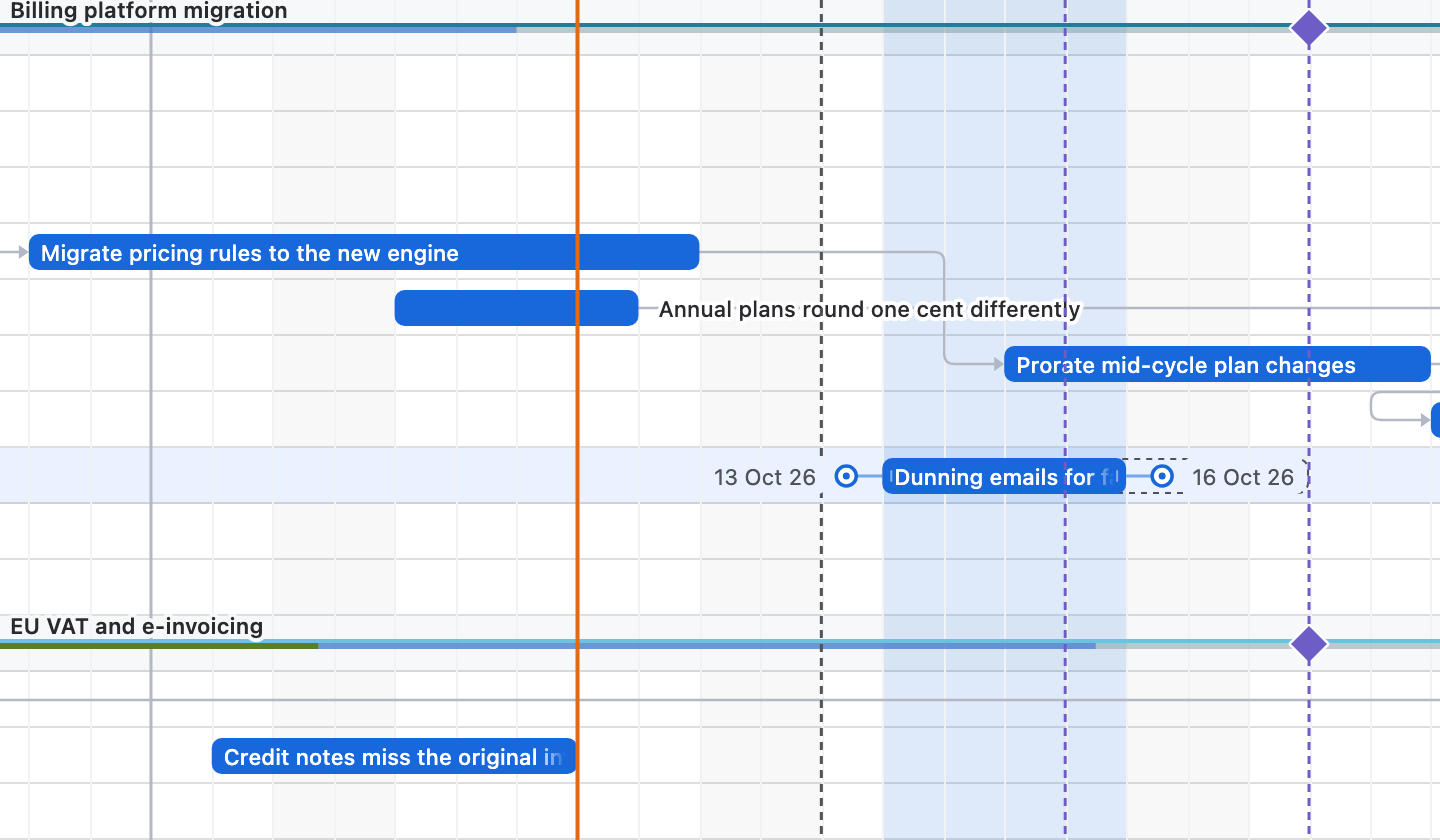
Drag the middle of a bar to move it, or an end to change its length, a day at a time. The new dates show beside the bar and Esc puts it back. Ganttry saves the change and counts it beside Publish until you publish it to Jira.
Step 6
Work on several issues
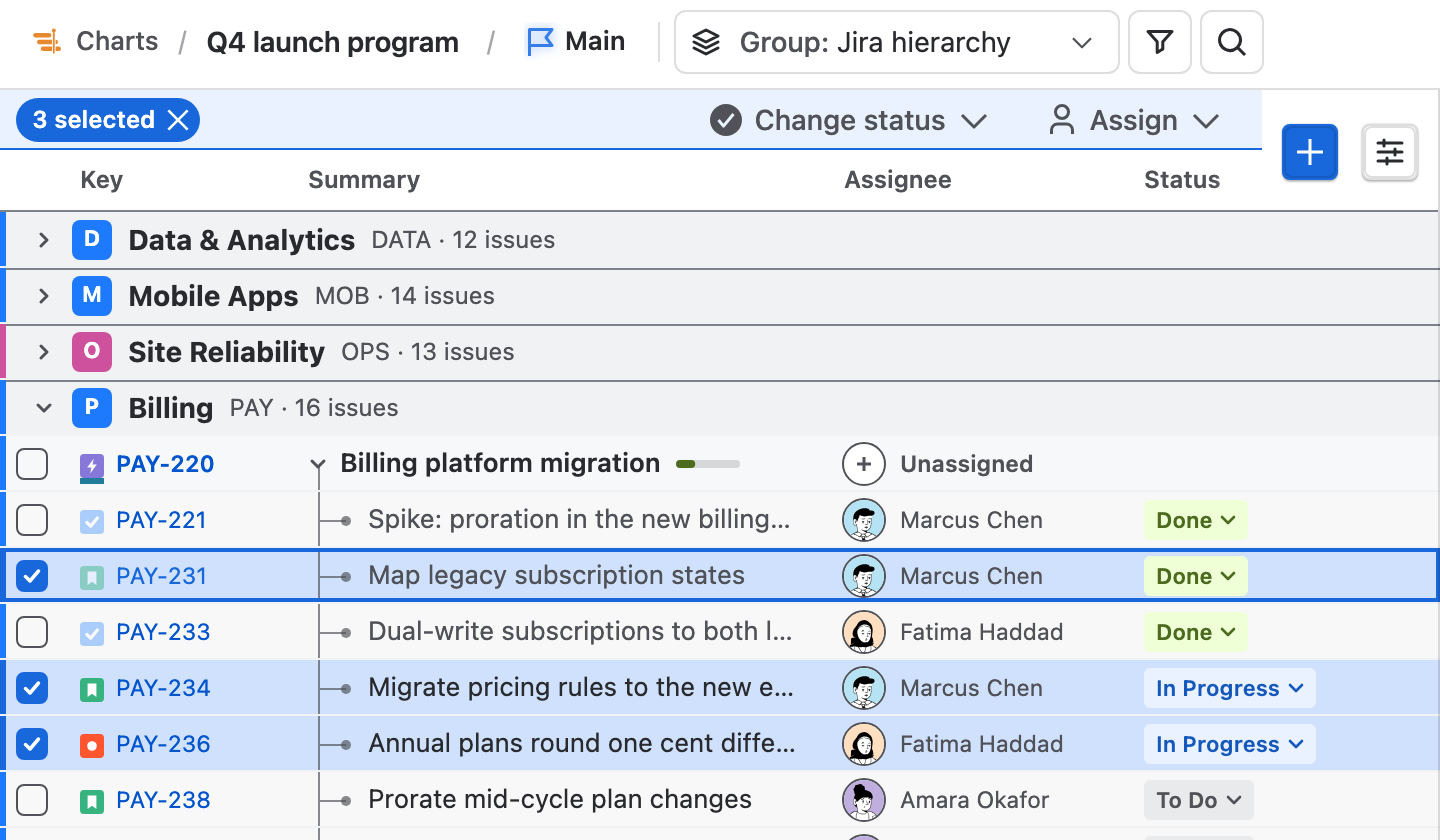
Ctrl- or ⌘-click rows, Shift-click to take a range, or press Ctrl/⌘+A. The selection bar above the headings changes the status or assignee of all of them at once.
Drawn by Ganttry
The same chart, as an export draws it.
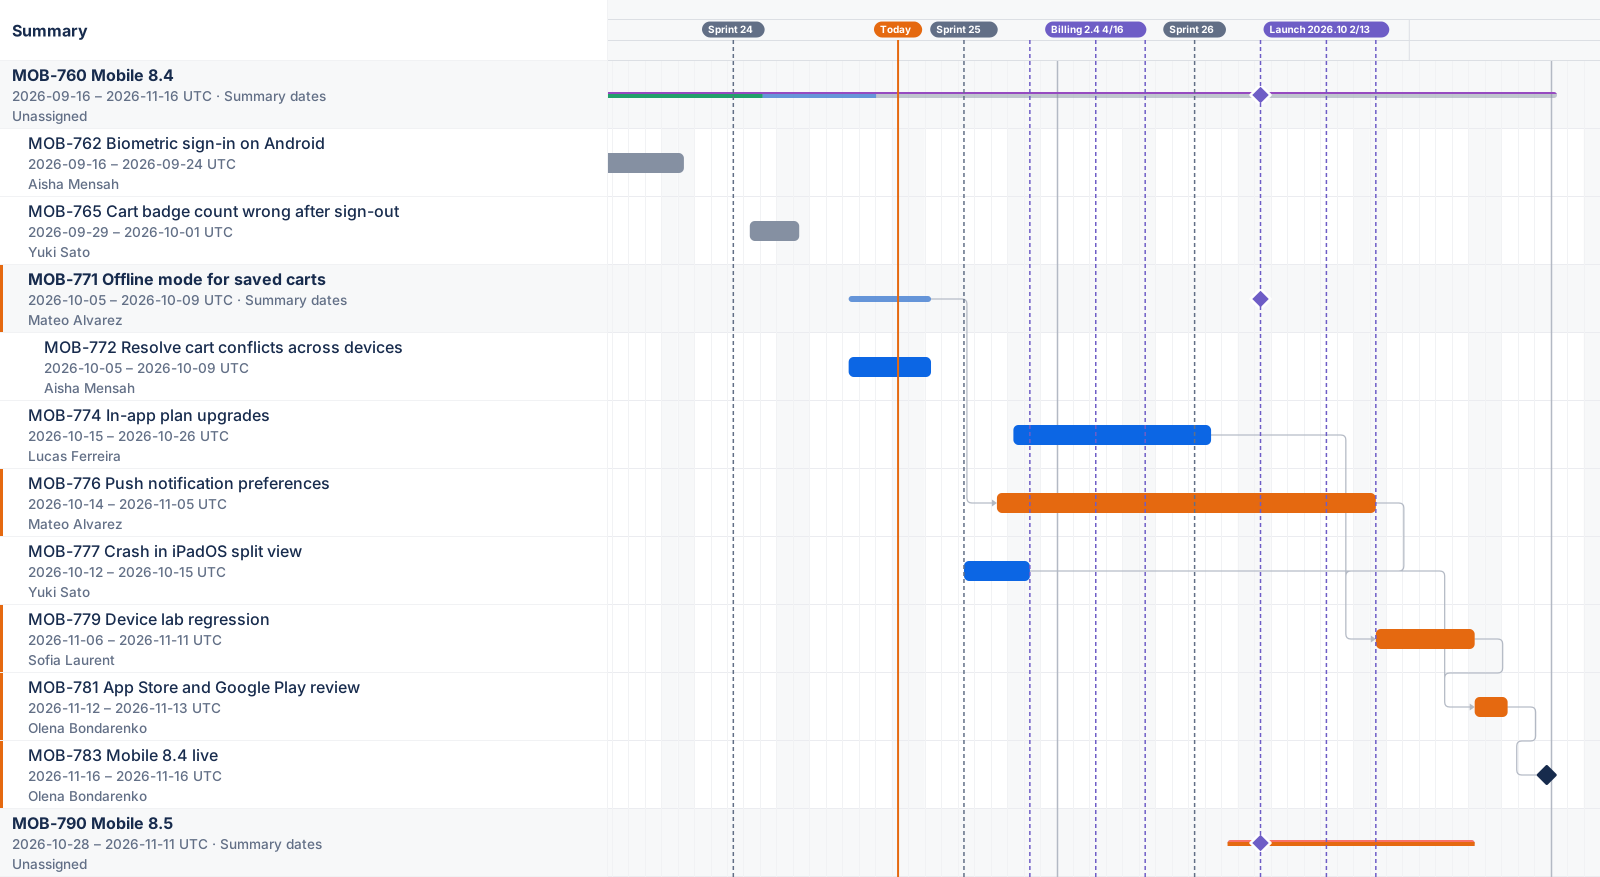
This figure is Ganttry's own export renderer, as a vector: each issue's key, summary, dates and assignee beside its bar, with the links, sprints, releases and Today that a PNG or PDF export draws.
Good to know
- Plan changes stay in Ganttry
- Moving, resizing and placing bars is saved in Ganttry and shared with everyone on the chart. Jira's dates change only when you publish the changes you choose.
- Status and assignee are Jira edits
- Changing status or assignee from a cell, a menu or the selection bar is a Jira edit made with your own permissions, and only the transitions Jira allows are offered.
- Saved views for everyone
- Chart settings keeps named views of grouping, columns, sort, filters and zoom. A view holds no dates, and everyone on the chart can apply it.
- Keyboard and screen readers
- Shortcuts cover zoom, Today, Fit, search and undo, and Help → Accessible task table lists the whole plan as a table that works with the keyboard and a screen reader.
Read more in the docs
Ganttry for Jira Cloud