Sharing and exports
Send the plan to people who need to read it. Board and view links, saved views, PDF, PNG, HTML, Excel, CSV, calendar and Microsoft Project.
11 sections6 min readUpdated October 2026
The Share panel
Choose Share in the chart header. A panel opens under the button without covering the chart. Press Escape or choose Share again to close it, and focus returns to the button.
Share is in the header of every full-page chart, on a Jira project page and on Ganttry's global page. The dashboard gadget, the issue activity tab and the Confluence macro have no header, so they have no Share.
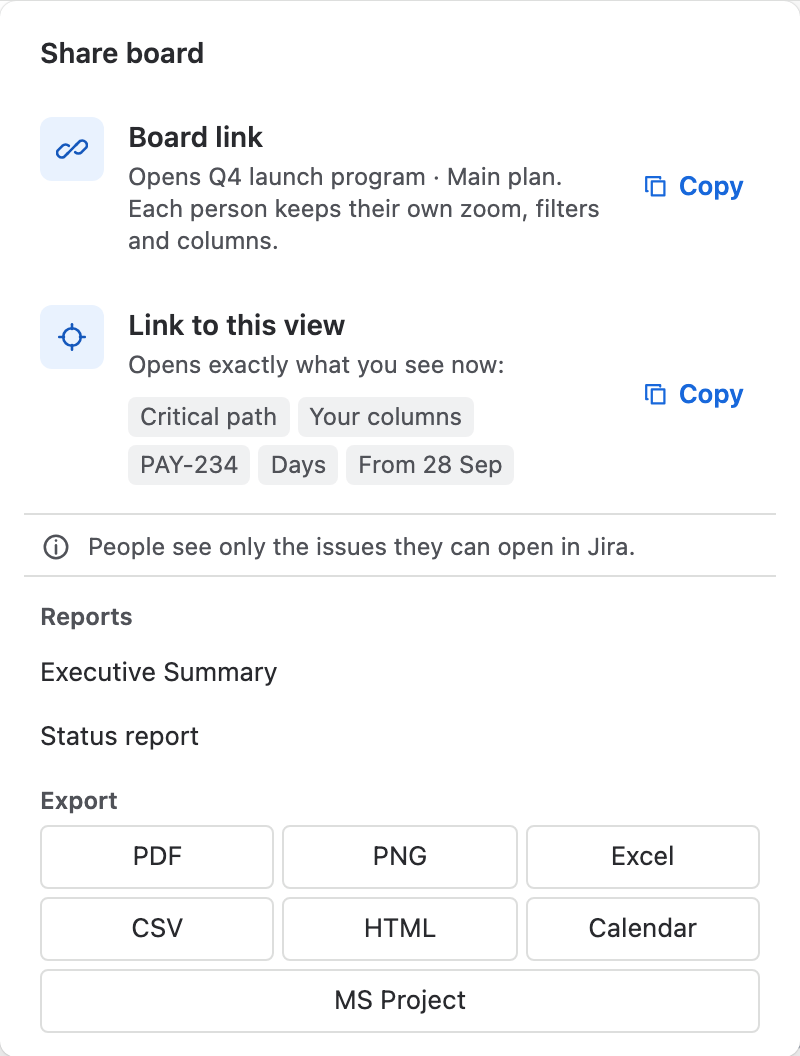
- Board link and Link to this view, each copied with one click.
- Reports: the Executive Summary and the Status report.
- Export: PDF, PNG, Excel, CSV, HTML, Calendar and MS Project.
Board link and link to this view
Both links open the same chart in Jira. Choose Copy beside one; it changes to Copied for a few seconds. If the browser refuses the clipboard, the link appears selected in a read-only field so you can copy it yourself.
| Link | Opens | Good for |
|---|---|---|
| Board link | The chart and its active scenario. Each person keeps their own zoom, filters and columns. | A plan someone will keep coming back to. |
| Link to this view | Exactly what you see now: the grouping, filters, search, selected issue, your columns, the critical path setting, the zoom and the horizontal and vertical position. | Pointing someone at one issue, one team or one month. |
Links to a scenario
Links open the scenario that is active when you copy them. On any scenario other than Main plan, the panel warns: Both links open the scenario “…”, not Main plan. Switch to Main plan first if the recipient should see the plan everyone works from.
Who can open a link
- A link opens the plan inside Jira, under the recipient's own Jira permissions. It creates no public page and grants no access.
- People see only the issues they can open in Jira; issue security applies to every row.
- Where a chart has no Jira address to link to, the panel says so and offers only the reports and exports.
Saved views
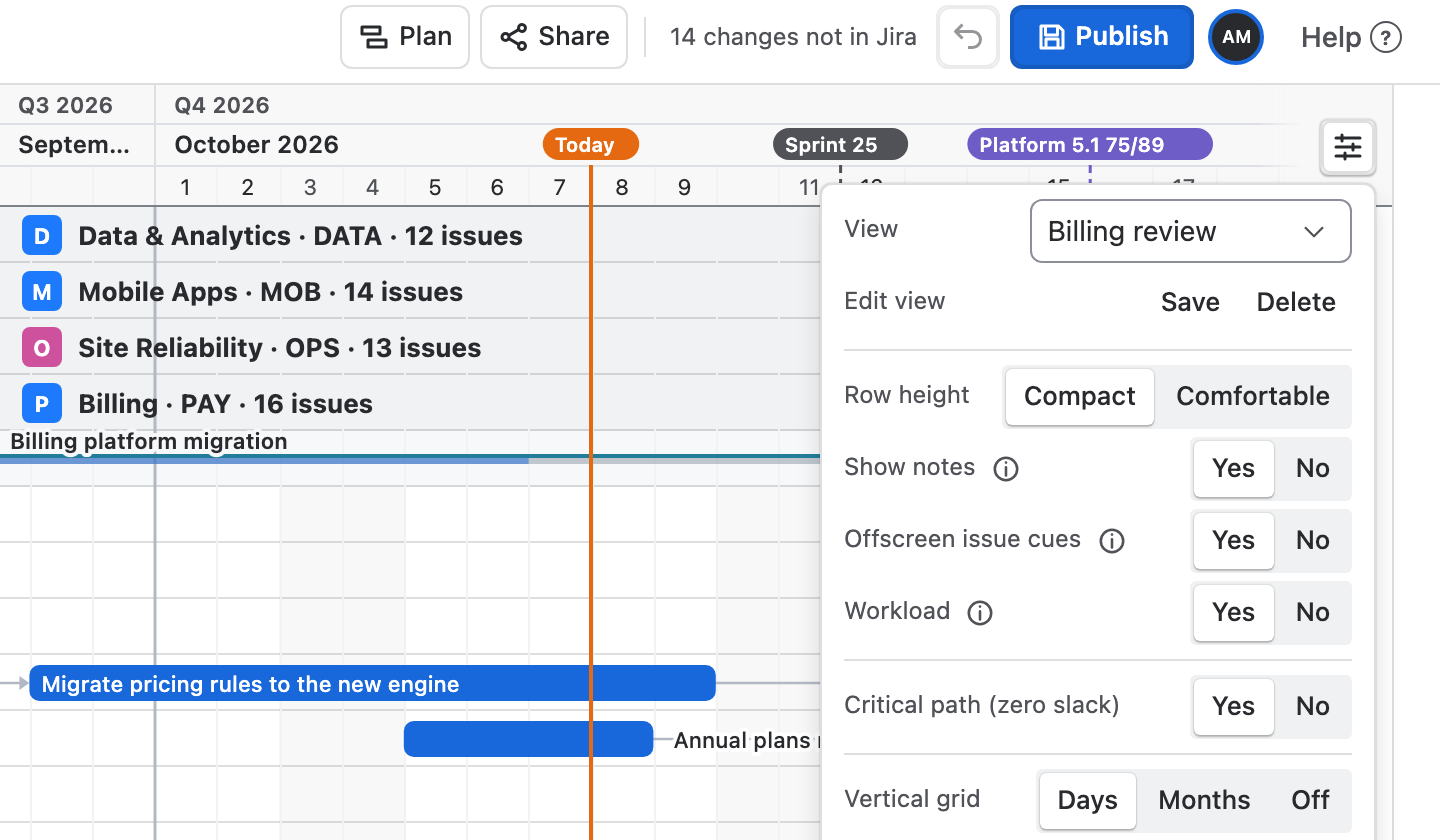
A saved view keeps a way of looking at the plan under a name: the grouping, the columns, the sort, the search, the filters, the zoom and where the chart is scrolled to. It keeps no dates and no placements. Everyone who opens the chart gets the same list of views.
- Open Chart settings at the right of the timeline header.
- Set up the chart the way you want it, then choose Save beside Edit view.
- Name the view and choose Save view.
- To use a view, pick it in the View list. Not saved means what you see is not a saved view; Delete removes the view on screen.
- A chart holds up to 12 views, with names of up to 60 characters.
- Saving under a name that already exists replaces that view.
- Saving and deleting views need permission to edit the plan. Combined charts have no saved views.
Reports
Both reports read the whole plan, not only the rows that are expanded.
- Executive Summary rates the plan On track, At risk or Off track and shows completion, the plan finish with its critical tasks, the P80 forecast, dependency health, open risks with their exposure, releases at risk, overloaded people, over-capacity sprints and, with a baseline, the worst slip. Decisions needed lists what to act on.
- Status report is Markdown that Jira, Confluence and Slack render: dates and progress, rows needing attention, the forecast at the team's actual rate, the baseline comparison, releases and people over capacity. Edit it, then choose Copy. Open status report in the Executive Summary opens it too.
- Time in status and Ask Rovo are in Plan, not Share.
PDF, PNG and HTML
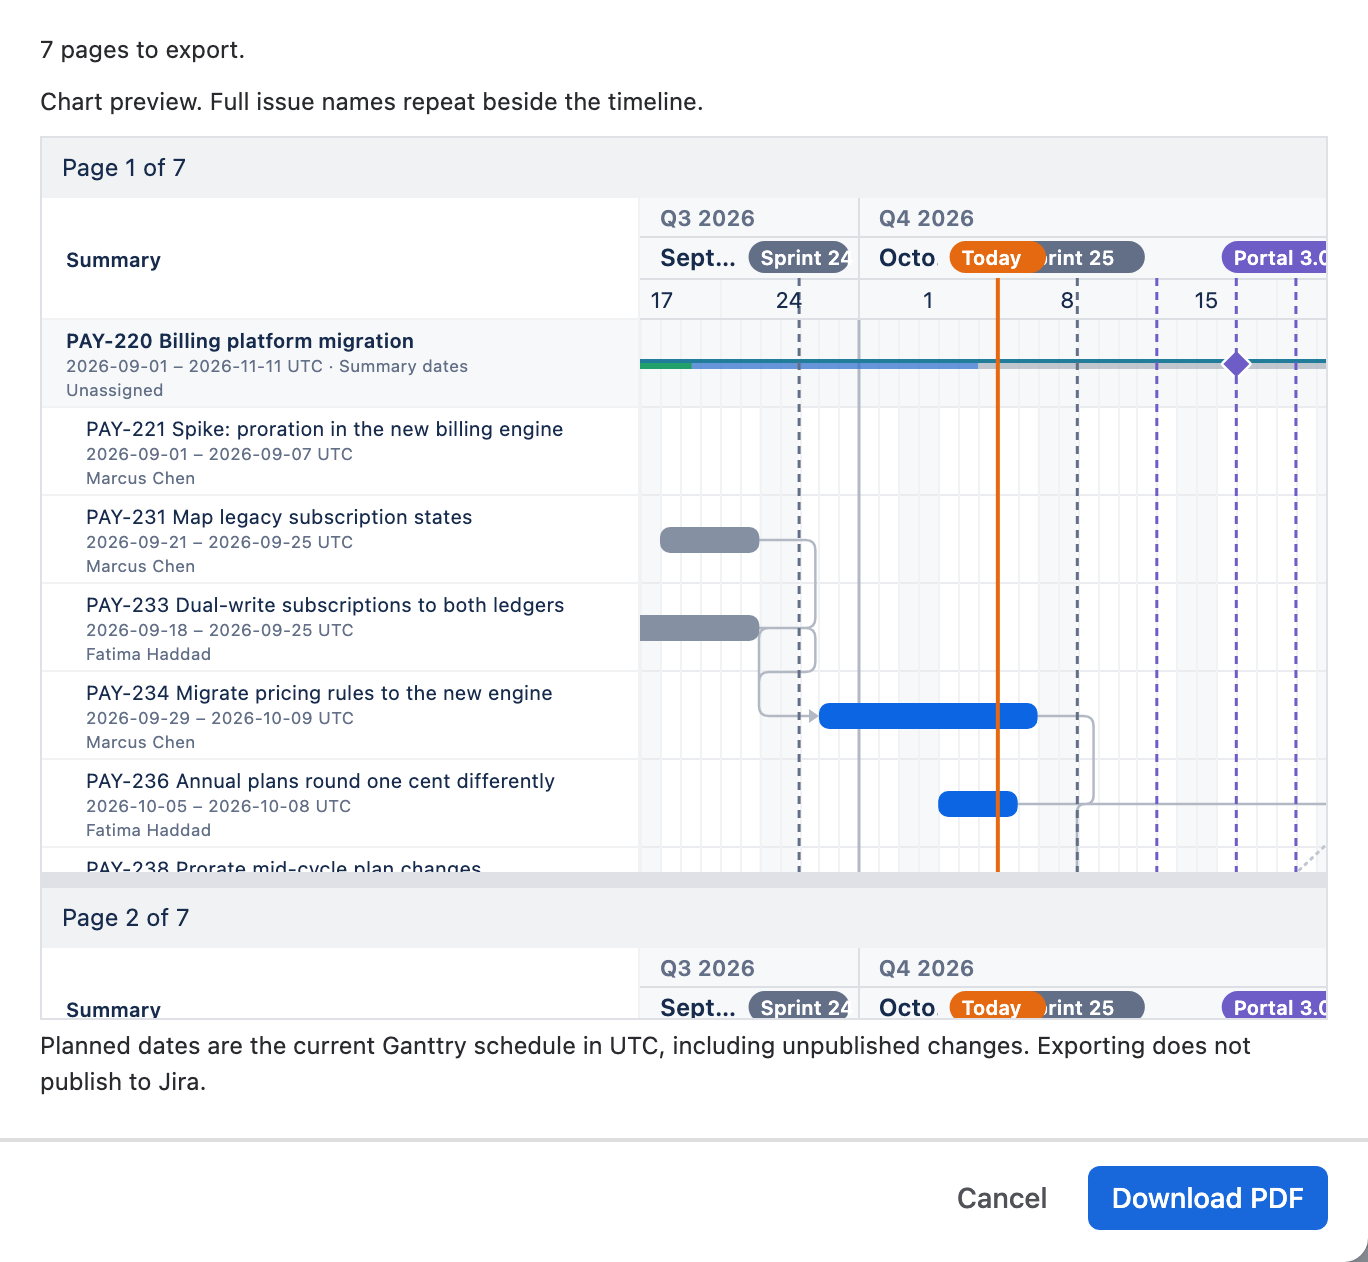
These three draw the chart as a report: a light palette, wrapped full issue names, a legend and no editing controls. The dialog shows its options at once and a preview as soon as it is ready; the download button waits for the preview.
| Option | What it does |
|---|---|
| Export scope | Current view keeps collapsed rows collapsed. Filtered issues expands the filtered hierarchy. Full plan needs the whole plan loaded and no filters. |
| Timeline start, Timeline end | Blank dates fit the selected issues. A custom range crops the timeline, not the issue list. |
| Show planned dates | Prints each issue's dates under its name. |
| Show baseline | Draws the baseline, when the chart has one. |
| Show notes | PDF and PNG only. Adds public notes and their period bands; private notes are never exported. |
| Include assignees, Include assignee emails | Prints owners, and their email addresses below the names where Jira makes them available. |
| Timeline layout | PDF only. Fit timeline on each page or Spread timeline across pages. |
What each file holds
| Export | What you get |
|---|---|
| A searchable report with a legend and Jira links. Up to 250 pages; a larger report is blocked, not cut short, so narrow the scope or fit the timeline. | |
| PNG | An image at double resolution on short pages. A large plan downloads as numbered images in one ZIP, with every selected row, and the button says Download ZIP. |
| HTML | One self-contained file without scripts: complete chart images and a searchable table of the issues. |
| Excel | One row per issue with native dates and numbers, Jira links, frozen headings and identifiers, worksheet filters and a separate sheet describing the export. |
| CSV | Summaries, assignees, issue types, parent keys, Jira links, your custom columns, planned UTC dates, elapsed hours and baseline variances. Formula-like text is protected. |
| Calendar | All-day UTC events for milestones and program dates, Jira release dates and, if you choose, issue finish dates. |
| MS Project | Project XML with the Jira hierarchy, manual UTC dates, working durations, calendars and holidays, assignees as resources, baselines, Jira links and dependency lags. |
Excel, CSV and Microsoft Project
Choose Filtered issues or Full plan as the Export scope; the dialog counts the issues. Collapsed rows and parent context are included, and Excel and CSV add the custom columns shown in the table. Elapsed hours, slack and finish variance count nights and weekends, and a negative finish variance means earlier than the baseline.
Microsoft Project opens the tasks manually scheduled with UTC dates and calendars, so the dates are this plan's. Display groups are left out, and so are dependencies that leave the exported scope. A combined chart offers no MS Project export.
Calendar files
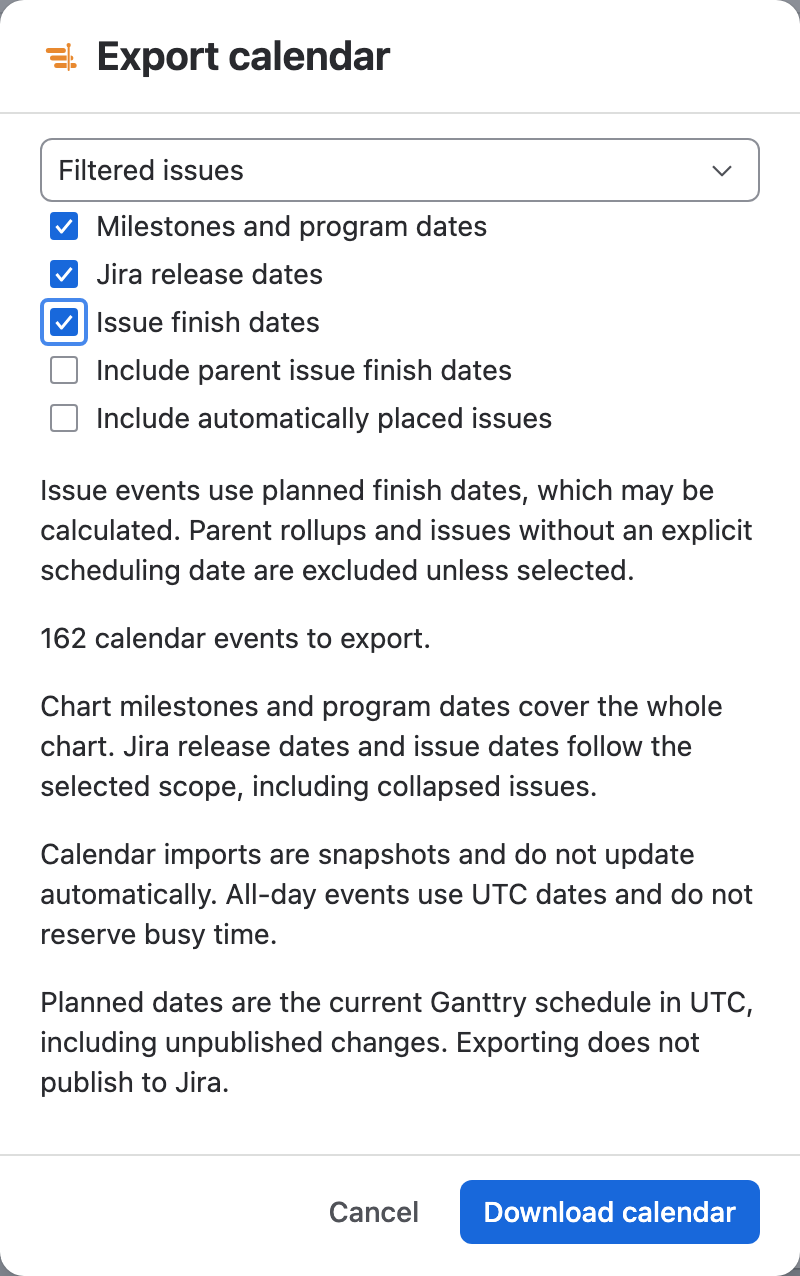
Tick what the calendar should hold. Chart milestones and program dates cover the whole chart; Jira release dates and issue dates follow the selected scope, including collapsed issues.
- Milestones and program dates and Jira release dates are ticked to start.
- Issue finish dates adds each issue's planned finish, which may be calculated. Include parent issue finish dates and Include automatically placed issues add the rows left out by default.
- Events are all-day UTC dates that do not reserve busy time. An imported calendar is a snapshot and does not update.
Before you send a file
- Planned dates are the current Ganttry schedule in UTC, including changes not yet published. Exporting does not publish to Jira.
- A file is a copy. Anyone you give it to can read it without Jira checking their permissions, so check the scope before you send it.
- Private notes are never exported, and HTML exports leave notes out.
- Email addresses appear only where Jira makes them available. Clearing Include assignees leaves out the emails too.
Related guideFor macro setup and testing, read the Confluence guide.
Stuck on something this guide skips? Write to the developers →